Devices and Manual monitoring points overview
After a successful log in, you will see the main page with three sections:
Map of devices and manual monitoring points - a world map indicating the position of your traps.
Search for devices and manual monitoring points - a panel with different search options for devices
List of devices and manual monitoring points - a list of all your devices
Map of devices and manual monitoring points
A world map indicating the position of your traps. The map is focused to your area. Traps are displayed with icons of different colors according to last number of catches and the pests alert levels set under Edit device of the device. Click on the icon displays some additional info of the trap like name, last event date, battery and signal level. Clicking on trap number link will redirect you to the Device events page. To see a detailed view of location click on Google maps link.

Search for devices and manual monitoring points
By default this section is minimized - open it with a click on its header. In case you have many devices, you can search for a specific one using this filter. You can search by different criteria:
Device no. - device’s serial number (barcode) with a leading “S”; when searching, you can enter only part of barcode into input field and you can also search for multiple devices if you separate complete barcodes with comma:
Name and location - name and/or location of the trap
Device model - model of the trap (Trapview STANDARD, Trapview+, Trapview AURA,…)
Traps to be shown - traps according the ownership - you can choose to see all devices (by default), or separately only those for which you are owner or observer
Type of last event - which event the device sent last (regular image sent, telemetry sent,…)
Last event from to - when the last event was sent (an interval between two dates)
Pest, Crop, Protection measure - select the pest, crop or protection measure filter
Image recognition - model of image recognition (/, segmentation, none - copy markings, R-CNN)
You have options to search devices with specific parts of the trap by click in checkboxs for sensors, antenna or self cleaning mechanisem and functionalities (weather forecast and pest forecast).
With the button Search execute the query. To clear all the criteria entered, use the button Clear.
List of devices and manual monitoring points
List of devices shows all devices which are visible to user. At top of devices table there is a quick filter which limits devices by Device no. or Location. Part of name or number can be entered. For example trap S01267 can be found by entering text “1267”.
Devices list can also be sorted by Device no., Location, Last event or New pests number. To change sorting click on header icons ![]() .
.
Each table row on list represents one device with its last known information:
Device no. - device’s serial number with a leading S. By clicking on it Device events page will be opened with detailed info about device events. There is also an icon
 , which takes you directly to the Mark pests editor, where you can edit markings of pests
Name and location - a thumbnail of last image with device description and current location. By clicking on thumbnail Device events page will be opened with detailed info about device events. In right corner there are icons with battery
 and signal level
  . By clicking on icon
  a new web page will be opened with exact trap location
Ownership - data about user’s rights in relation to device are shown through 2 icons - owner rights:
 ; view-only rights:
Monitoring info - data of which pest and crop you are monitoring
Last event - date and type of last event (could be image sent, telemetry sent…). When telemetry was last event, there is always a data of last picture event beside
New pests - number of new pests caught in the last day; if you click on this icon
 shows the Daily catches chart
Forecast alarm - this feature is to find out when are the adult insect population starts to considerably increase and when the adult insect population reaches its peak, which enables crop protection planning and also helps to identify insect development stages.
Device action menu - by clicking icon
 a menu will open with possible actions - Edit device, Device monitoring info, Start new monitoring period, Schedule self cleaning
Monitoring points
This functionality enables combination of early warning system with standard monitoring methods. Under monitoring points user can store the images of sticky plates from the conventional - “manual” - traps. Uploading of images is possible only through Trapview mobile application, which can be downloaded from the application store: trapview (by Efos d.o.o.). This tool allows the end users to gather data manually and keep all pest monitoring data in one place together with the data from the Trapview automated traps. User can also add the data about numbers of the insects caught on the sticky plates or pests can be simply marked in the editor, pest chart will be drawn. Some additional data can also be entered (location, events, notes). You can create and edit the monitoring point under Devices, Monitoring points in the main menu.

Locations
When devices sends image or telemetry, we also receive its coordinates. Location change is automatically recognised when new coordinates are received. If there is already defined a location where device is, that location is offered. Otherwise user can define new location.
Area radius
Every location is defined with coordinates and radius. Radius is distance in users length measurement unit between coordinates and outer edge of location. User can define area radius when creating new location. In case of already defined location without area radius, user is asked to confirm or change area radius. When deciding about area radius user should consider size of his field or area that device is monitoring. Once area radius is set, it can not be changed.
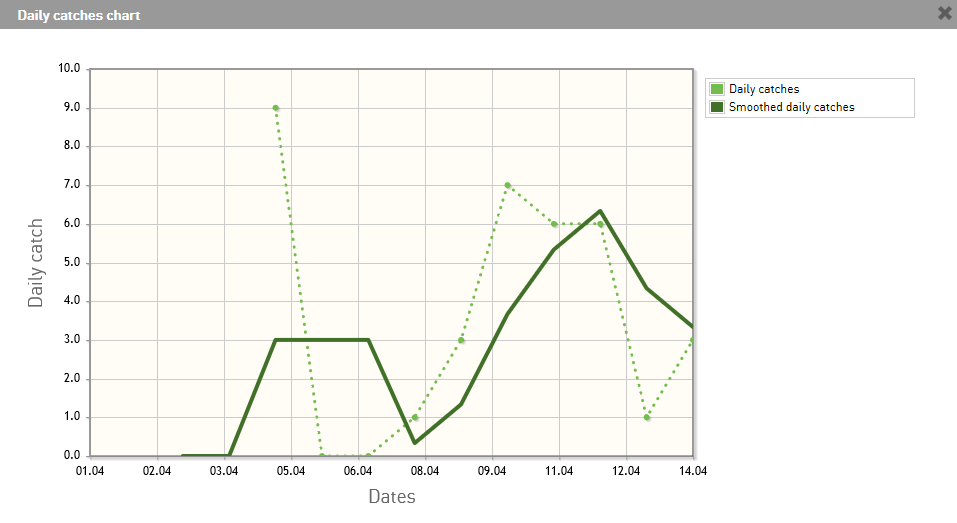
Daily catches chart
To open the daily catches chart you need to click on icon on the list of devices under new pests on the dashboard.
This graph shows the number of daily catches over the last 14 days. The green dashed curve represents daily catches and the dark green curve represents the average of daily catches.
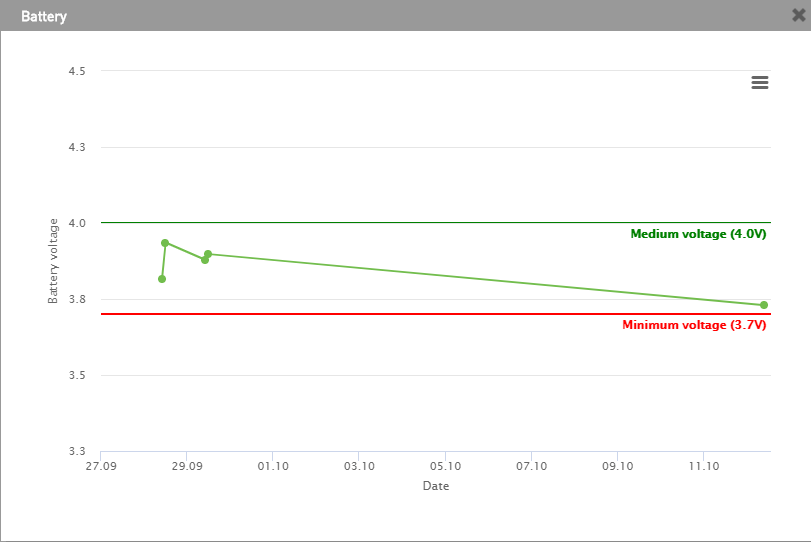
Battery level
Levels |
|
|---|---|
|
full |
|
half |
|
empty |


By clicking battery icon a new popup window will be displayed with detailed data chart of devices battery level history.
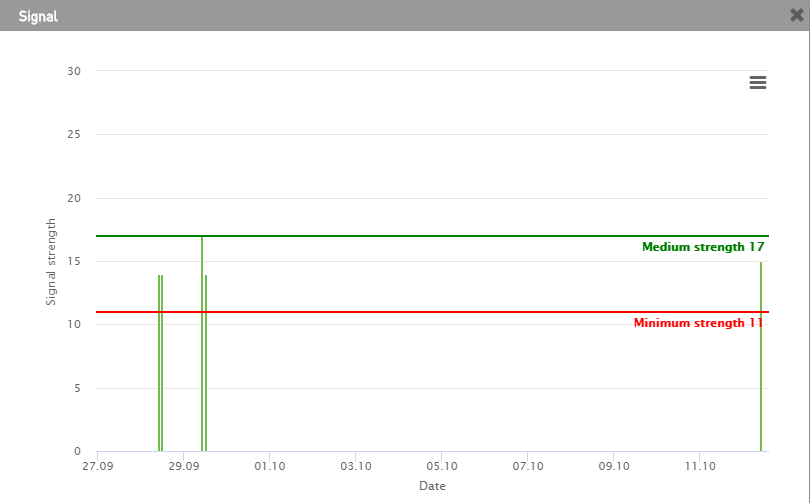
Signal level
Levels |
RSSI value |
RSSI dBm |
|
|---|---|---|---|
|
good |
from 17 |
to -79 |
|
avarage |
11 to 16 |
-91 to -81 |
|
low |
to 10 |
to -93 |


By clicking signal icon a new popup window will be displayed with detailed data chart of signal strength history.
Last event
Here you have the information of when and what event the device sent as last. If last event was not a picture, then there is always also a data about last image sent.
Possible events |
|
|---|---|
|
regular image |
|
regular image, firmware upgrade |
|
unexpected event |
|
telemetry |
|
broken telemetry |
|
SMS sent |
|
deleted image |


