Device events
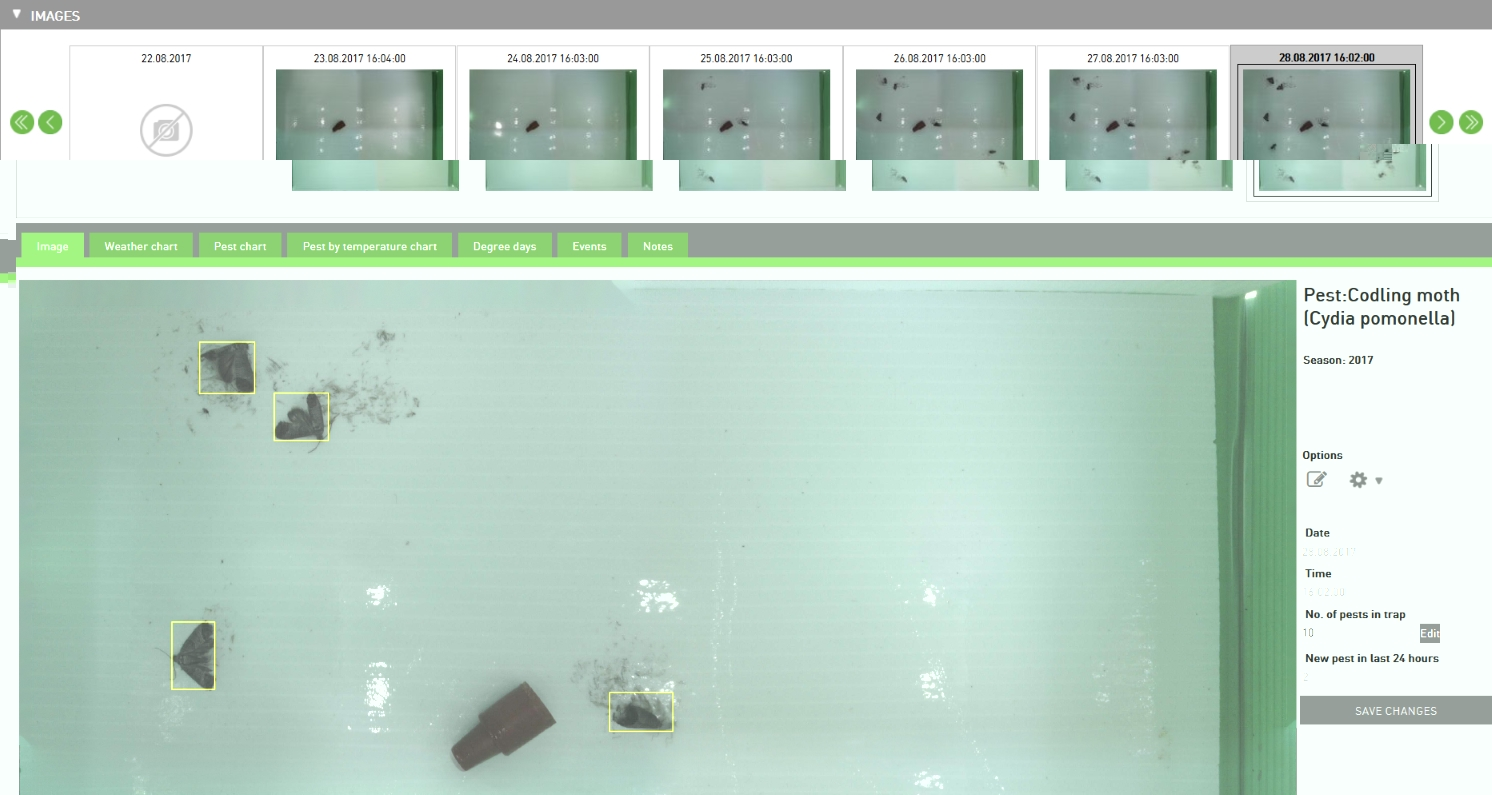
Here you can browse and analyze all the data that your device has sent (photos, no. of pests and weather data - optional). At the top there are all the images taken with the latest one selected, so that you have its preview below. As you select any other image, the preview tab changes - it shows the image selected above.
Special cases: |
|
|---|---|
|
No stitching - the trap doesn’t have the stitch file yet, so it cannot show the stitched image (to see the original images taken, choose Show separated images under the Options) |
|
Image not sent - there is no image for selected day |


At the lower part there are six tabs:
Weather chart (optional)
Pest by temperature chart (optional)
Degree days (optional)
Image
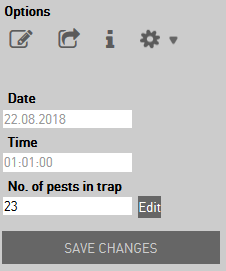
Detailed view of the image selected above. On the right side you have some additional information (when the picture was taken, number of pests) and some other options available. You can directly edit number of pest by entering value into No. of pests field and click on button Save changes. If you want to edit more days quickly use Edit button which will open a new window. Use this function when the images are similar through week and you would like to set the same number of pests on all images.
Options
The following options are possible by clicking on cogwheel  icon:
icon:
Show image (or double-click on the image) - full screen image preview - this functionality works only with unmarked image
Show separated images - non stitched preview; with double-click on the individual image you will get a full screen preview
Show stitched image - stitched preview
Show marked - preview with the pests marked
Show unmarked - clean preview (without markings)
Compare with previous - compare two consecutive images - this functionality works only with unmarked image
Close compare - close the compare preview
Mark pests
 - opens an editor where you can mark pests manually
Device monitoring info
 - opens a window with a current monitoring informations
Edit device - opens a window where you can edit main data of the trap
Show device location - a new window with the exact trap location (coordinates) opens
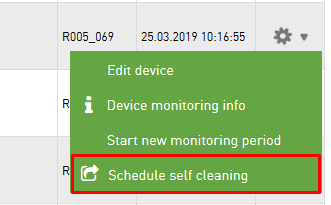
Schedule self cleaning
 - set the command for turning the sticky roll after the next image
Delete image - delete the selected image
For Mark pests and Schedule self cleaning also shortcuts are made for faster access.
Mark pests
Every picture taken is processed and analyzed by an automatic image recognition module which identifies, counts and marks pests with yellow rectangles. As the automatic image recognition can never be 100% (strange position, multiple pests together, …) you have the possibility to correct and mark them yourself - they change color to green.
Icone  always takes you to the SVG editor, where you can edit markings.
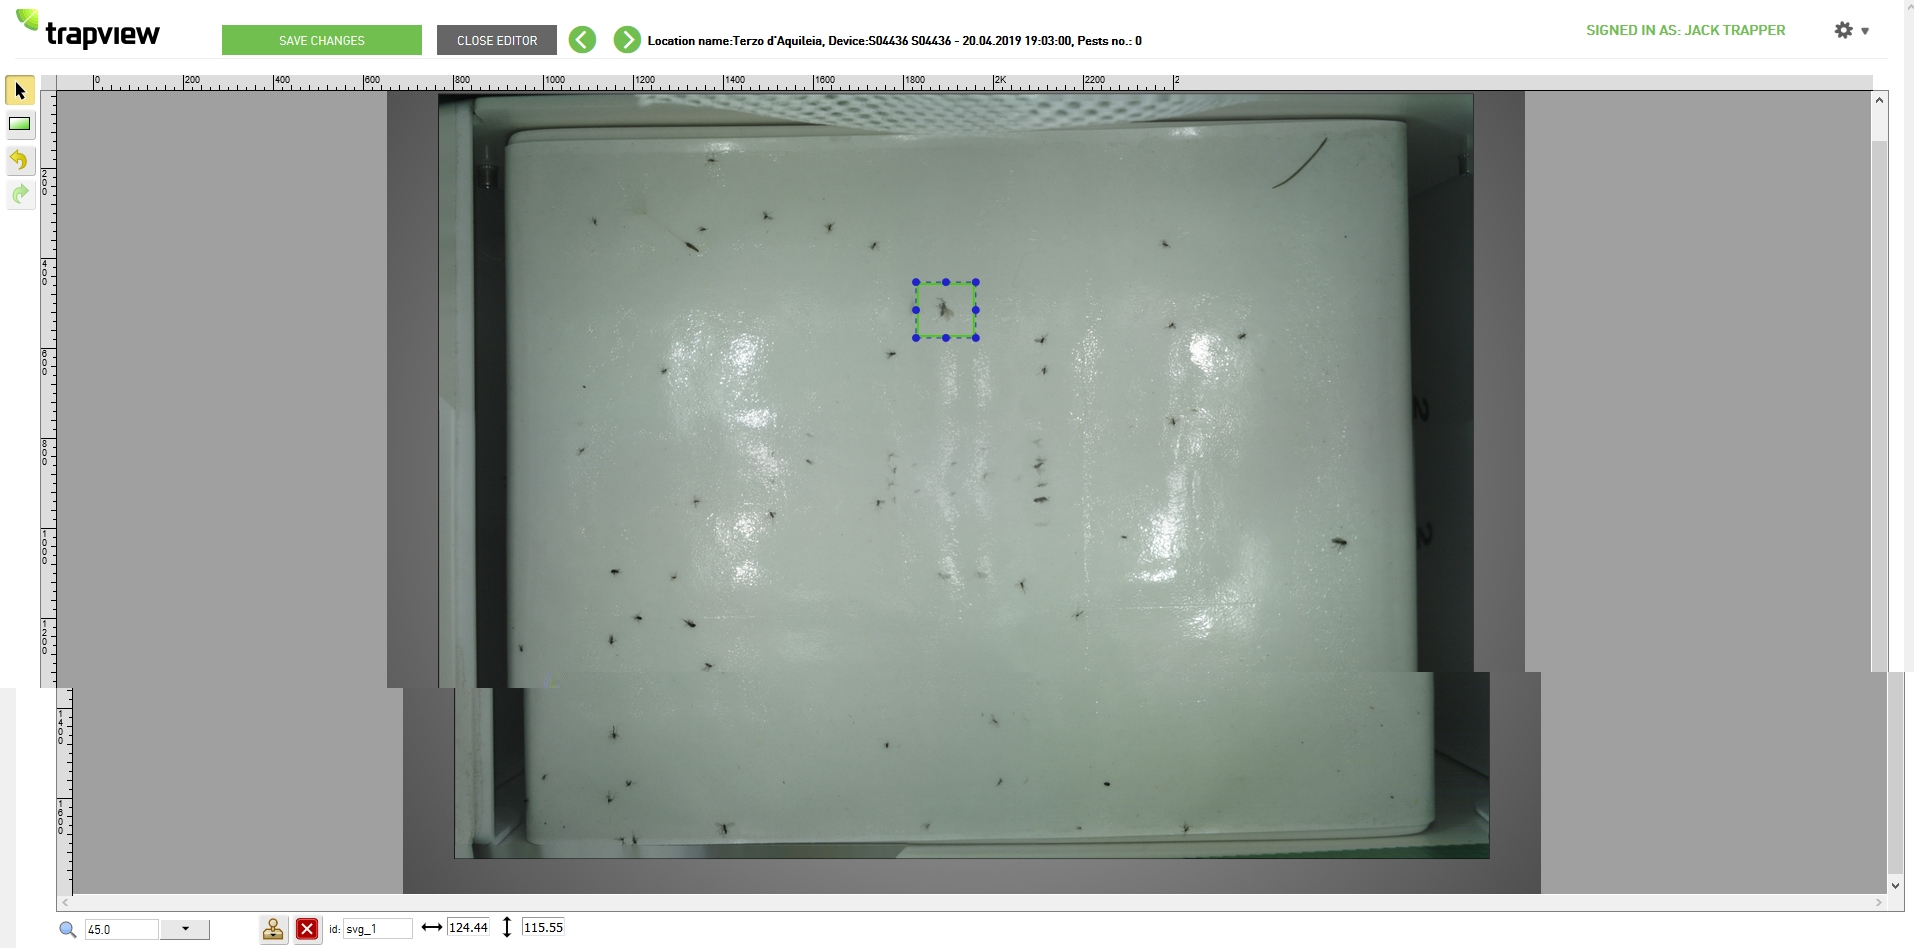
Editor tools and actions:
Select
 : with a click onto the marking square you select it
Move: click into the square and drag it
Resize: select it and drag one side or corner
Delete
 : select and click Delete Element icon (backspace/Delete)
Mark pest
 : select Pest tool (or press R key) and select the area
Duplicate
 : select and click Duplicate Element icon (or press D key)
Undo
 (key Z)
Redo
 (key Y)
Be sure to save changes before you close the editor.
If you are editing images for more days, you can move from one to the next or previous with back/forward buttons  . Be sure to save changes for each day separately.
Schedule self cleaning
You can access section Schedule self cleaning by two paths.
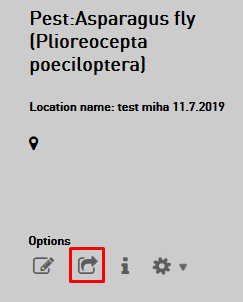
First is from Devices and images page (current main page) - if you choose action Schedule self cleaning under cogwheel options. Second link to the Schedule self cleaning is when you are in Image section - again there is an option for choosing it under options menu with click on icon of schedule self cleaning ![]() .
.
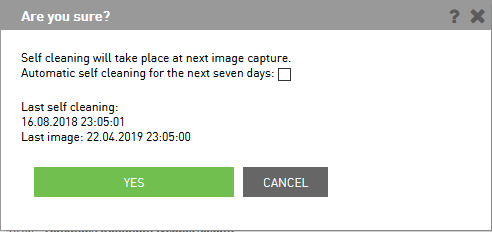
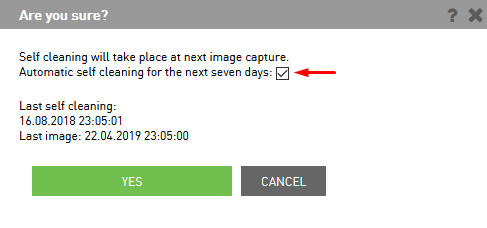
When you click on the SC icon, opens a pop-up, where ask you are you sure if you want to trigger self-cleaning. Self-cleaning will take place at next image capture. Before you trigger self cleaning also you have the information about when was the last self cleaning and when was sent the last image.
To trigger self-cleaning click on Yes or Cancel if you want to cancel it.
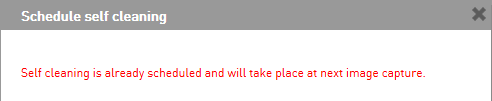
In case the self-cleaning is already scheduled but not yet performed, you can not trigger this command again. If you do, the popup window will be displayed informing you about this.
Automatic self cleaning
If you want to set automatic self-cleaning for the next seven days, click on chechbox to set it. Under it are the info about when was the last self-cleaning and when was the last image sent.
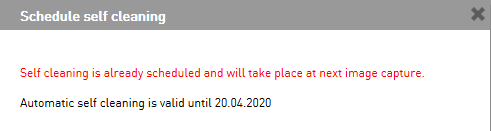
Also, information about when the last self-cleaning operation will take place is added (which is especially useful when an automatic weekly self-cleaning is scheduled). The one week automatic self-cleaning is already scheduled. It is performed once a day after the picture is sent. Automatic self-cleaning is valid for the next 7 days from the day you set automatic self-cleaning.
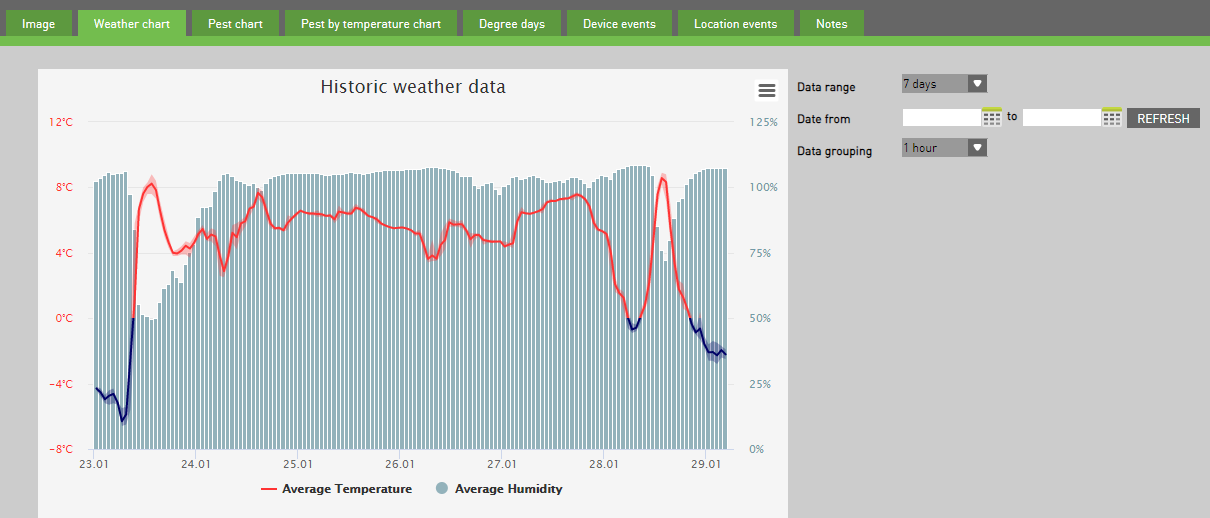
Weather chart
The weather chart is optional - you can see it if selected trap has the temperature & relative humidity sensor.
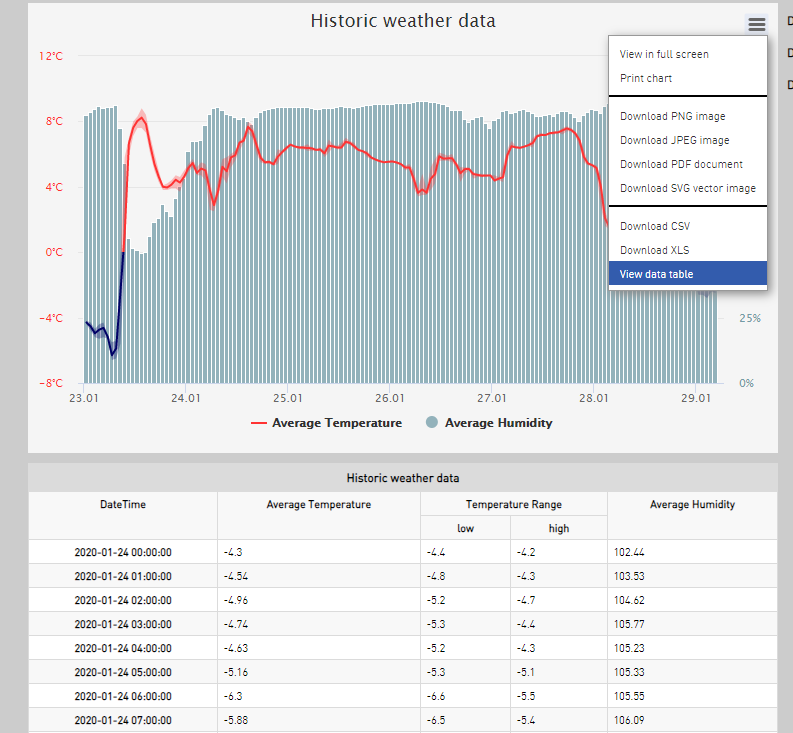
Blue bars represents relative humidity, the orange line represents the temperature. You can choose the data range to be shown (from 7 days to 365 days) or you can choose the preview for the period between two dates.
By clicking on chart context menu  you have the following options:
view in full screen - view the chart on full screen
print chart - print chart
download PNG or JPEG image - download PNG or JPEG image on computer
download PDF document - download PDF document on computer
download SVG vector image - download SVG vector image on computer
download CSV - download data in Excel on computer
download XLS - download data in Excel on computer
view data table - to view data table under weather chart in app
To see the data from the chart in table you need to click on Chart context menu and select View data table.
If your device including the weather forecast you have under “weather chart” another chart of the “weather forecast”. Below is the table with the forecast for the next seven days.
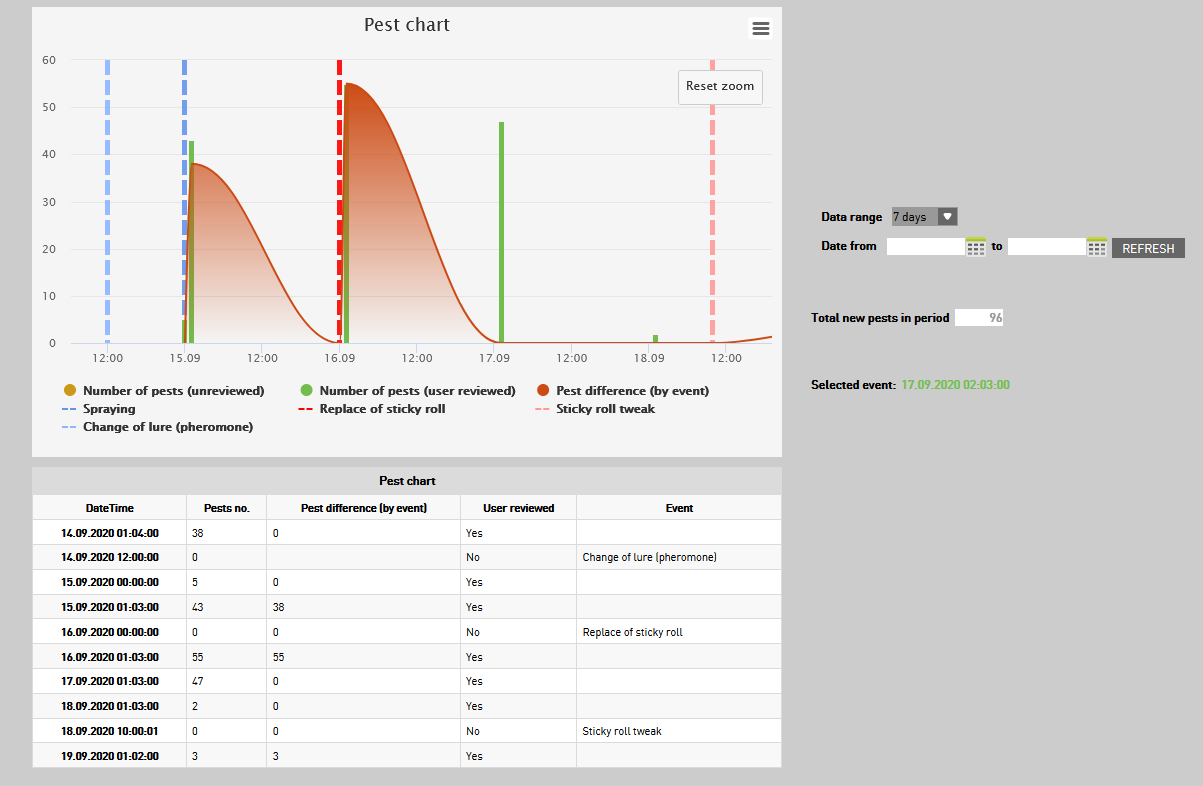
Pest chart
Orange bars represents the number of pests detected automatically, green bars represents the number of pests reviewed by user and the red area represents the difference of the pests caught by day. There are also some events visible on the graph - they are marked with vertical dotted lines (like sticky roll tweak in pink, change of sticky plate in red, spraying in blue). You can choose various data ranges from a drop-down box. You can zoom in the selected range on the chart. To reset zoom click on Reset zoom button.
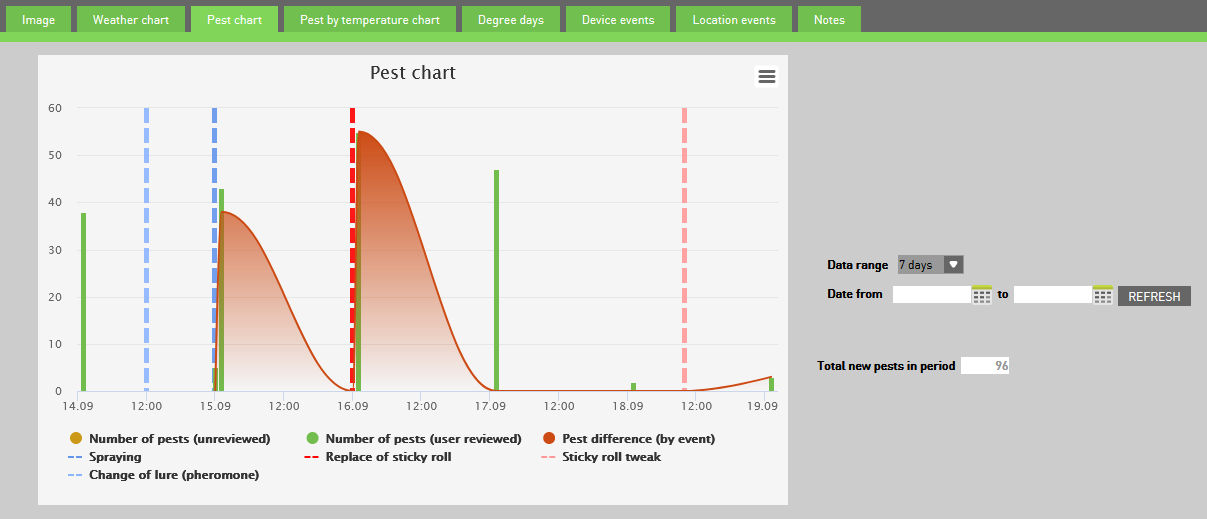
With a click on the colored box or its label in the legend on the top right, you can select/deselect the data to be presented in the chart.
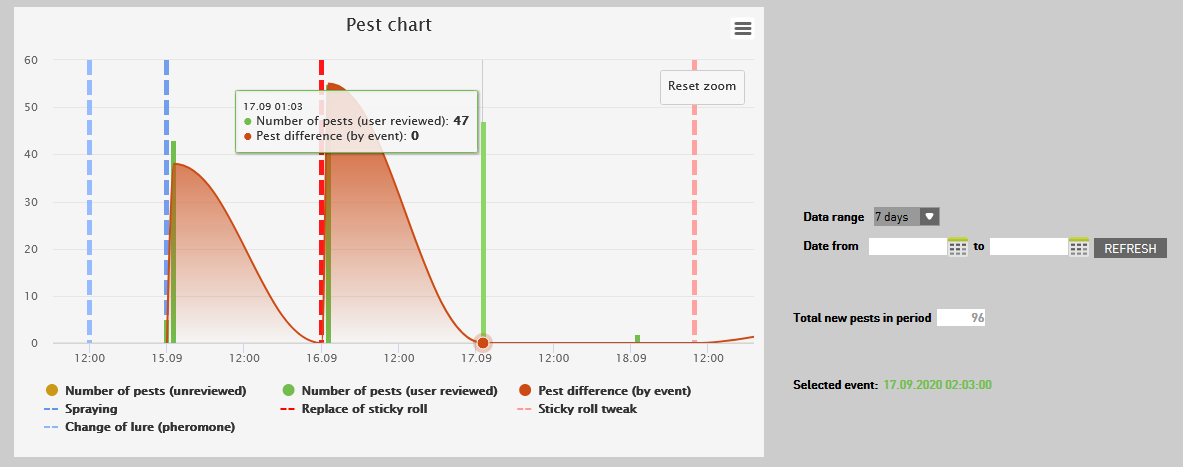
With a click on a bar, you get the exact time under Selected event and this is also a link to the corresponding event (photo) - image timeline will open in the week with chosen event and if you go to the Image tab, you will see a chosen image enlarged.
At the bottom you can view the pests table and make an export of data (Excel, CSV or chart).
Pest by temperature chart
This functionality is shown only when Cydia pomonella is monitored and if selected trap has the temperature & relative humidity sensor.
Orange bars represents the temperature at selected time (Temperature at hour), which is important for insect development; usually this is the time at which insect become active. The green line represents the number of pests caught. There are also two red boundaries, which are again adjustable for the temperature at which males become active and at which matting begins. You can choose various data ranges from a drop-down box or you can choose the preview for the period between two dates. If you select a range in the lower chart, the upper one will zoom in the selected range.

At the bottom you can view pest by temperature table and make an export of data (Excel, CSV or chart).
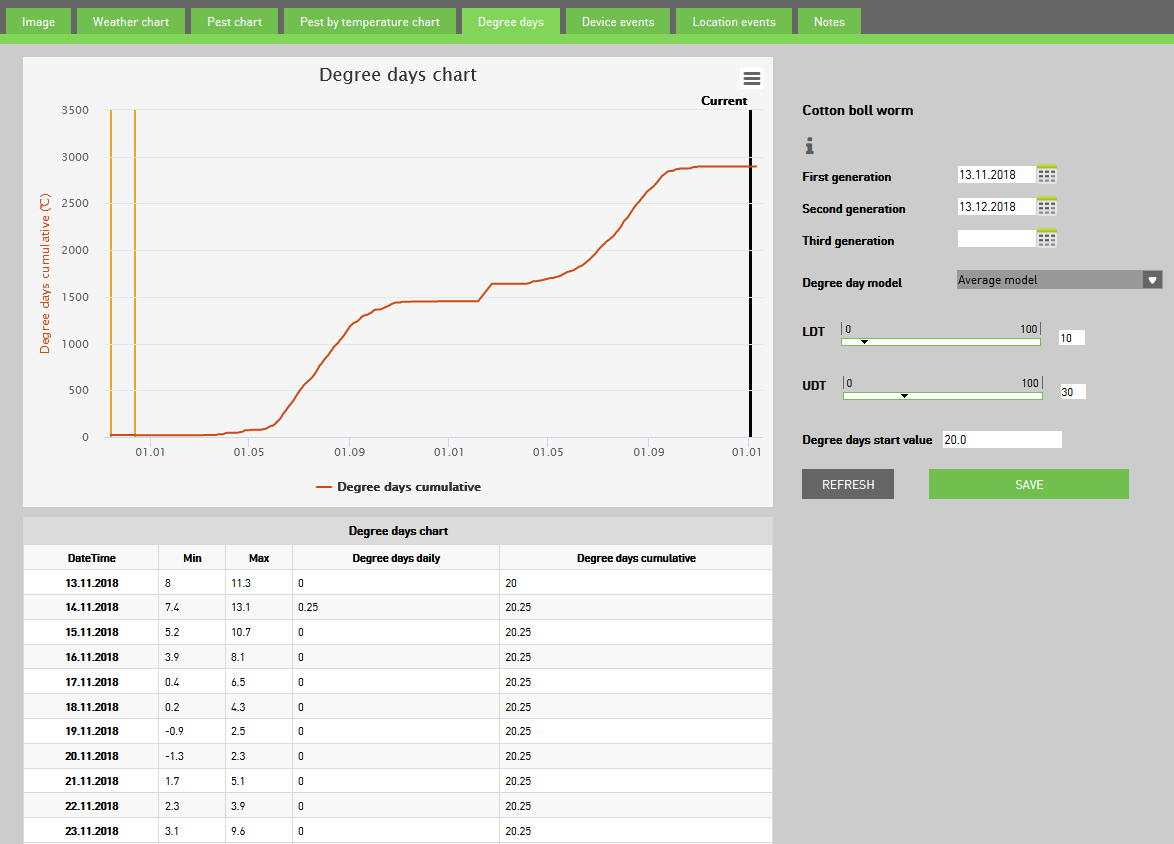
Degree days
This chart is shown only if selected trap has the temperature & relative humidity sensor.
The minimum temperature at which insects first start to develop is called the lower developmental threshold (LDT). The maximum temperature at which insects stop developing is called the upper developmental threshold (UDT). The lower and upper thresholds vary among species and has to be set for each species separately.
Degree days (DD) are based on the rate of an insect’s development at temperatures between upper and lower limits for development. Degree days are calculated according to Modified average method.
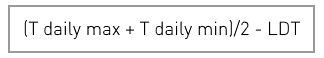
To account for situations when the daily minimum temperature is less than the LDT, or the daily maximum temperature is greater than the UDT, the formula needs to be modified. When either occurs, the LDT is used instead of the daily minimum, or the UDT is used instead of the daily maximum.
The user has to set Start monitoring date, LDT and UDT and degree days start to accumulate. When the start of second generation occurs (you have to enter the date), then degree days are reset to 0 and start to accumulate for the second generation and the same for all the next generations.
There is also an option to enter Degree days start value when device was installed in the field later than first DD should start to accumulate for this pest (DD model usually starts with the biofix - first moth activity in the season) and of course you need to pull the accumulated degree days from some other source.
The chart is not limited to the selected monitored pest, but you can add also other pests for generation phenology display when choosing Select additional monitored pest.
At the bottom you can view the degree days table and make an export of data (Excel, CSV or chart).
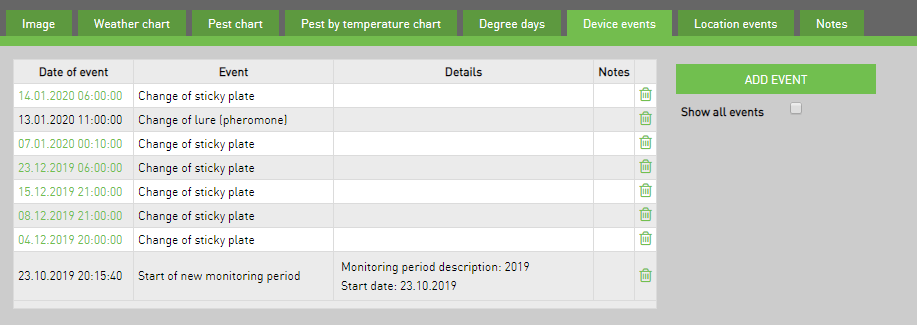
Device events
To add an event to device you have two options:
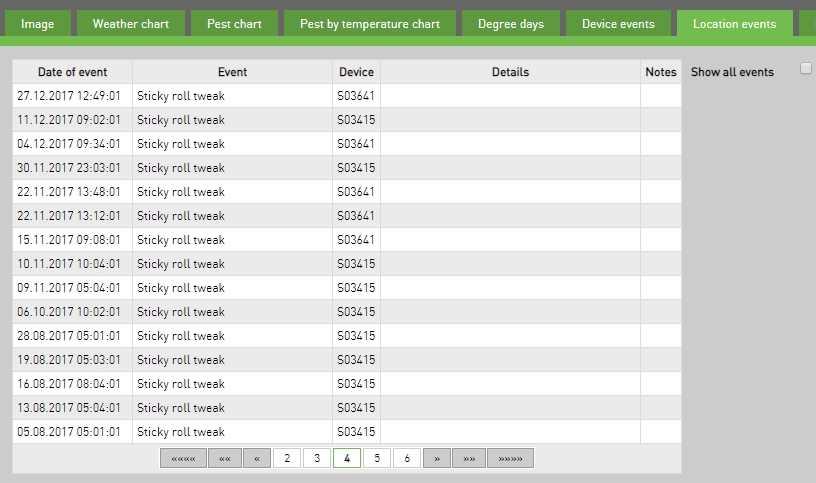
Under “device events tab” you have a list of all events of the trap (change of lure, change of sticky plate, sticky roll tweak, …). Some of those events are triggers for the alerts. In this list you will find information about events:
Date of event - the date when the event occurred or created
Event - the name of the event (sticky roll tweak, change of sticky plate, change of lure, start new monitoring period)
Details - details about event (ex. start new monitoring period)
Notes - other information about the event
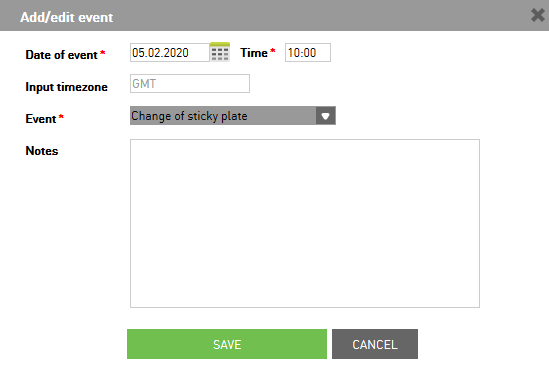
Add event
To add or edit events you click Add event and a popup window will be displayed where you enter the following data:
Date and time of event - select the date and time of the event
Device timezone - it set automatically (you can change it under user settings)
Event - select from the list which event do you want to add (change of sticky plate, change of lure (pheromone), spraying, observation on spot)
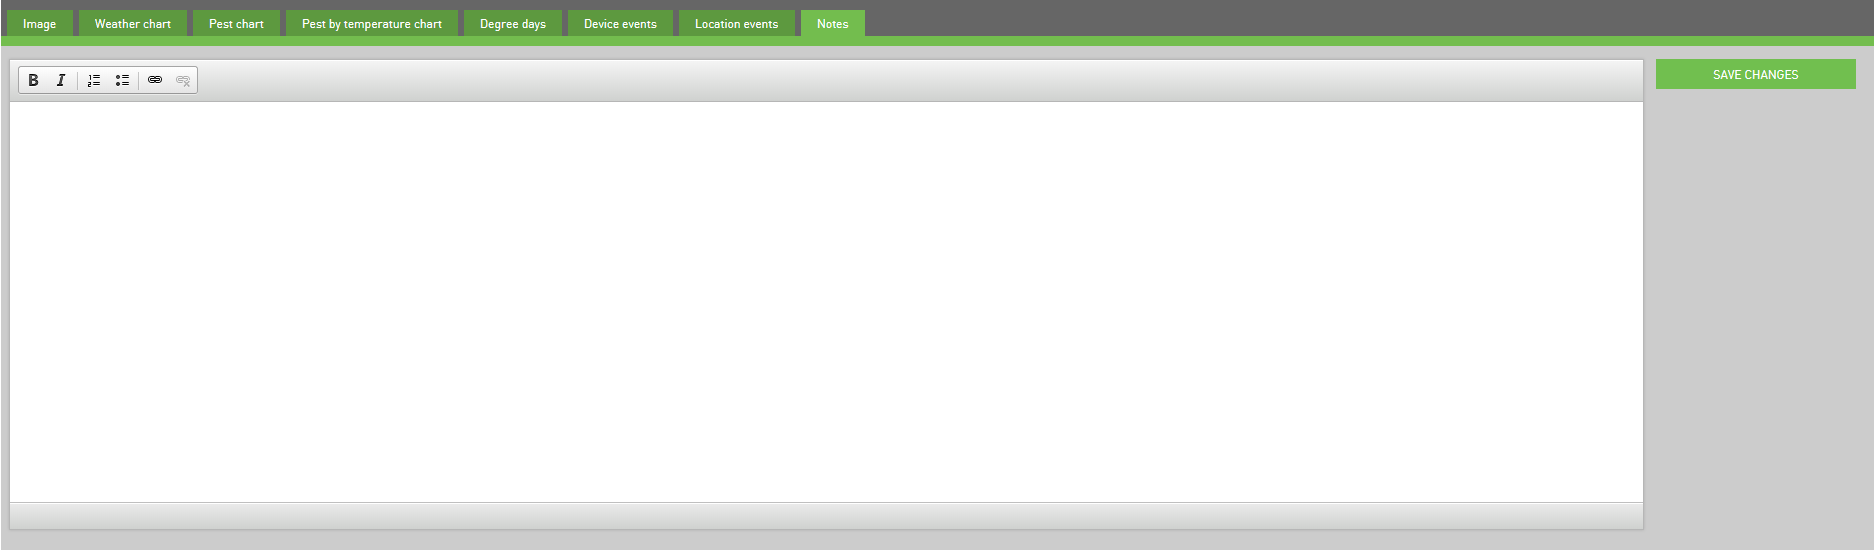
Notes - you can enter other information about event
To confirm settings click Save.
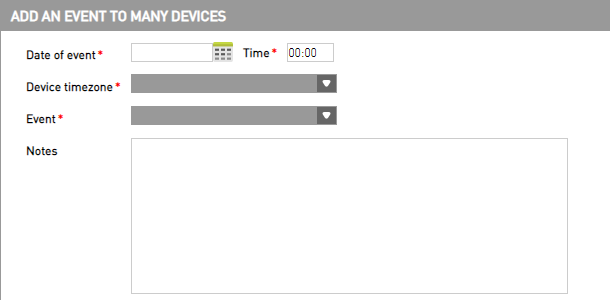
Add an event to many devices
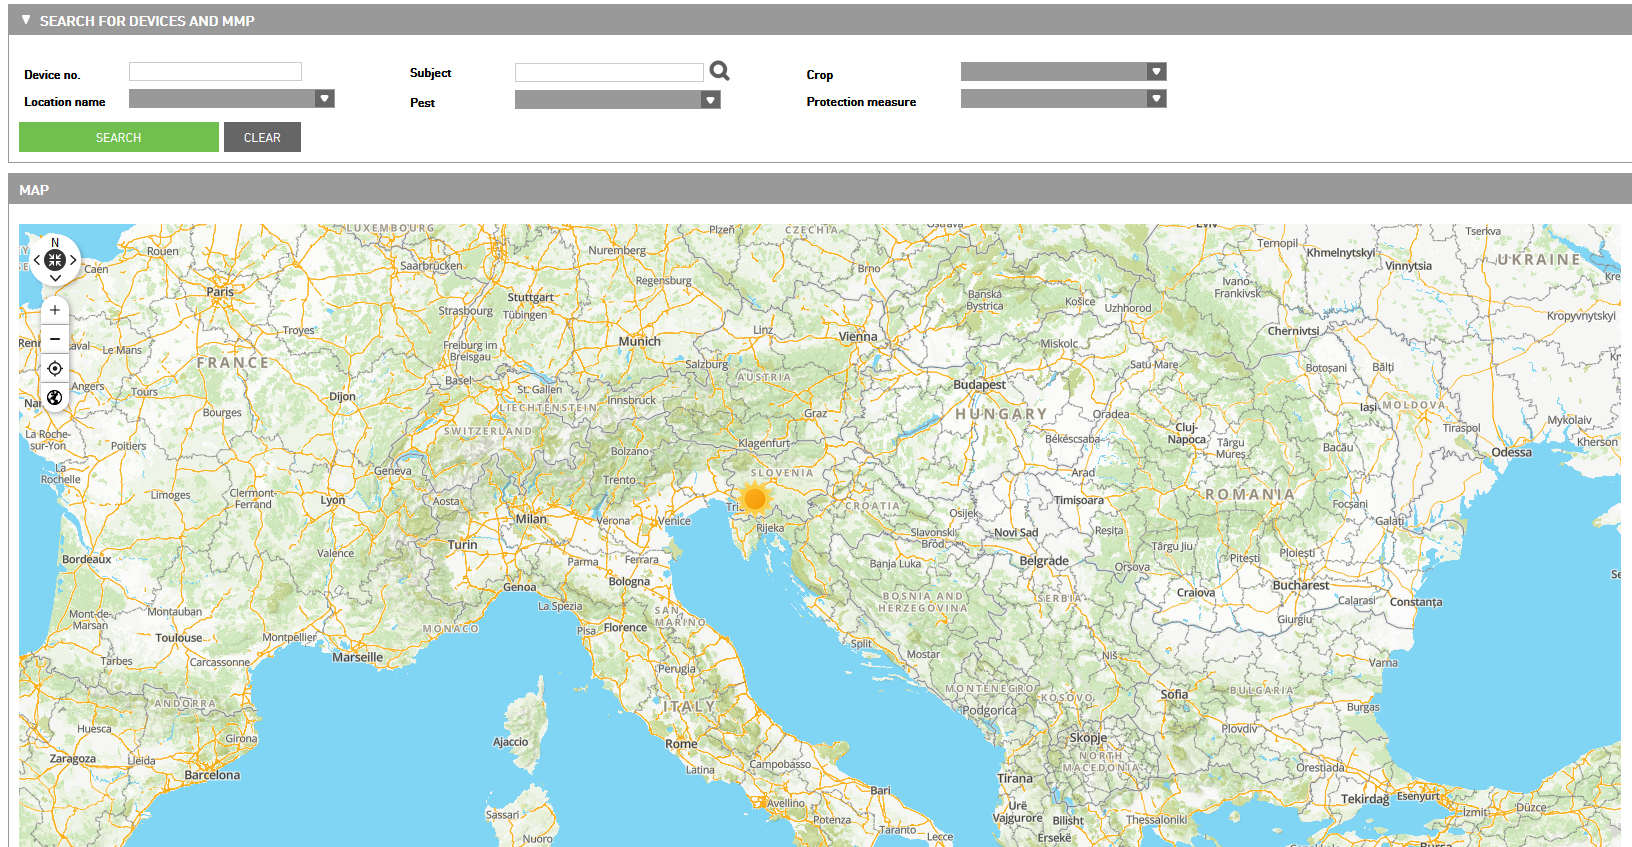
If you want to add an event to many devices go to Devices and MMP in main menu and select Add an event to many devices.
In a situation when you want to add an event to more devices at the sime time, go to Add an event to many devices under Devices and MPP in main menu.
To create an event you need to enter the following data:
Date and time of event - select the date and time of event
Device timezone - select the timezone of device
- Event - select the event which do you want to add (change of sticky plate, change of lure(pheromone), spraying, observation on spot, replace of sticky paper roll)
For the event change of lure you have the option to enter the data about lure product and validity of it. If you select the event spraying you need to insert the data of effective days, spray efficiency and select effected development stages
Notes - there you can enter some details about event
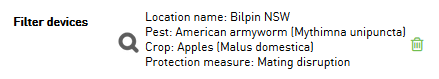
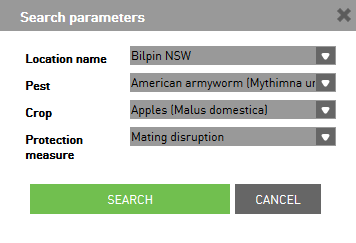
Filter devices - search for devices through the search parameters: location name, pest, crop and protection measure
Available devices - the list of all available devices to which you can add an event
Selected devices - the list of all selected devices
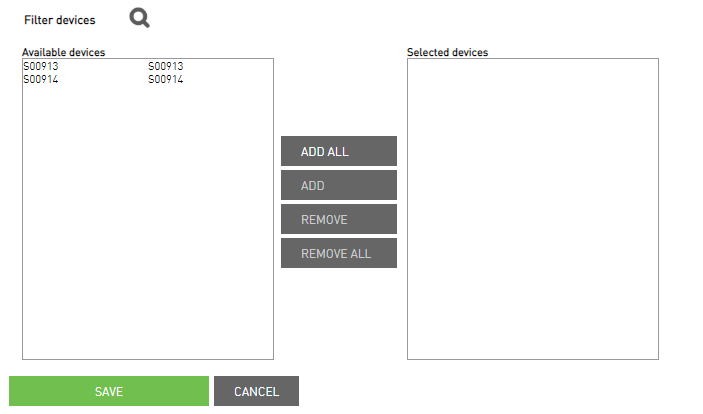
To save the settings and add an event, click the Save button. If you don’t want to add an event, click Cancel.
Location events
Under “locations events” tab is a list of all events which were happened on different devices with the same location.