Pest forecast
Under AREA WIDE OVERVIEW main menu you have a sector Pest Forecast.
The goal of this feature is to find out when are the adult insect population starts to considerably increase and when the adult insect population reaches its peak, which enables crop protection planning and also helps to identify insect development stages.
Our system uses data from traps, historical data and enables the use of the data from external sources like weather station to predict such considerable insect population increase for 3 to 10 days in the future.
For each trap a user can observe understandable visual representations of their data together with notification about pest forecast alarms.
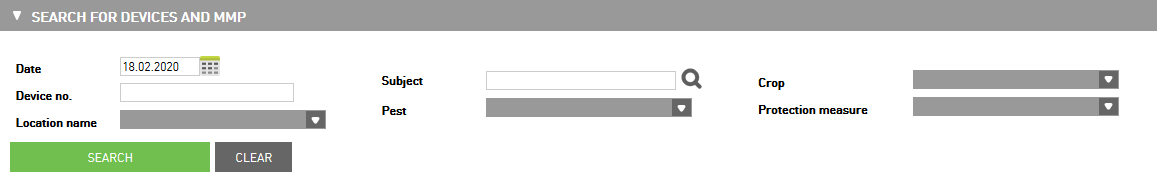
Search for devices
You can search by different criteria to find devices for which you want to make an observation of pest forecast:
Date - insert the date of observation
Subject - select the subject
Location name - search for devices from the same location
Pest, Crop, Protection measure - select the pest, crop or protection measure filter
Map of forecast alarms
On the map, you have the icon  which represents an alarm. Different colors of the icon show which type of alarm the trap has:
Forecast alarms |
|
|---|---|
|
no alarm |
|
medium forecast alarm (pay attention) |
|
high forecast alarm (planning crop protection) |


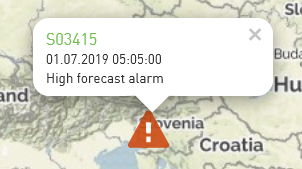
When you click on the icon shows the information about device serial number, when was the last event of the device and which type of alarm it has.
Forecast alarm chart
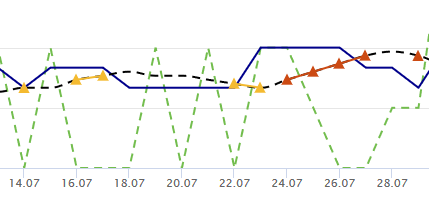
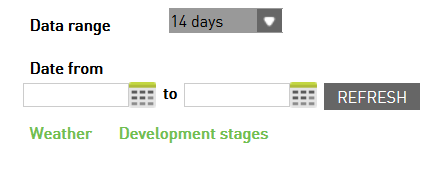
The forecast alarm chart shows the data about rescaled and smoothed daily catches and forecast alarms in a selected period of observation. You can select a date range of showing data from 7 to 365 days.
The other option to select the period of observation is the select date from/to. When you select the date you need to click on Refresh button to refresh data in a chart.
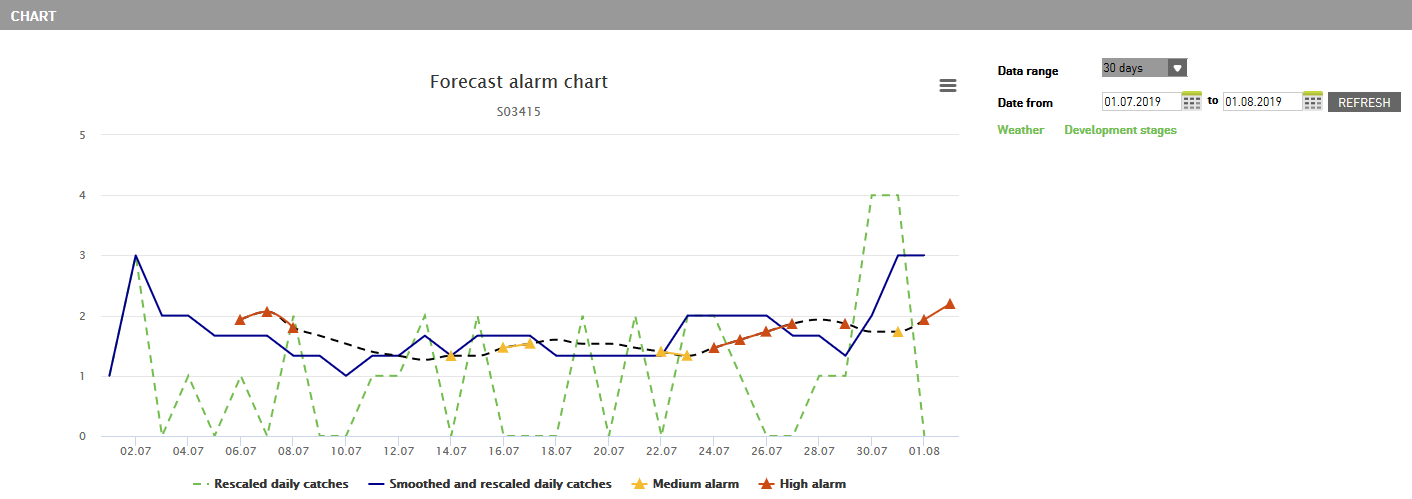
Because the pest forecast depends on the weather forecast we have a link to it. At the same time, it is also related to development stages, so we have a link to the development stages graph.
On the chart, you can see when in the selected period alarms active and which type of alarm is. The yellow alarm means to pay attention because of prediction of peak start. The red alarm means to start planning crop protection.