Development stages
Under AREA WIDE OVERVIEW main menu you have a sector Development stages.
It allows users to easily view the predictions of pest development stages and determine the most appropriate time for spraying based on the weather forecast. To select the appropriate time for spraying, it is important to know the population dynamic of the observed pest. This information helps you to select the right type of pesticide for each development stage for spraying.
Search for devices
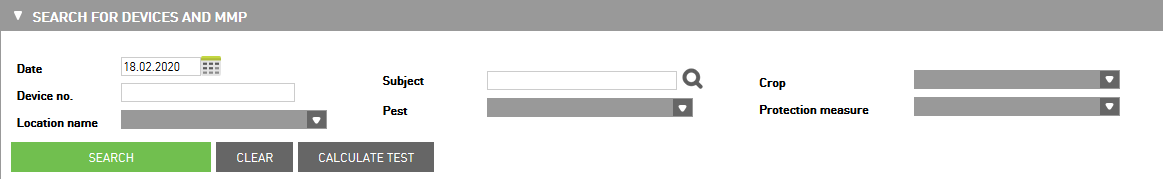
Date - insert the date of observation
Subject - select the subject
Location name - search for devices from the same location
Pest, Crop, Protection measure - select the pest, crop or protection measure filter
Map of development stages
On the map, you see the icons of development stages. There is the following development stages:preoviposition, egg, L1 - L7 (larva), pupa.
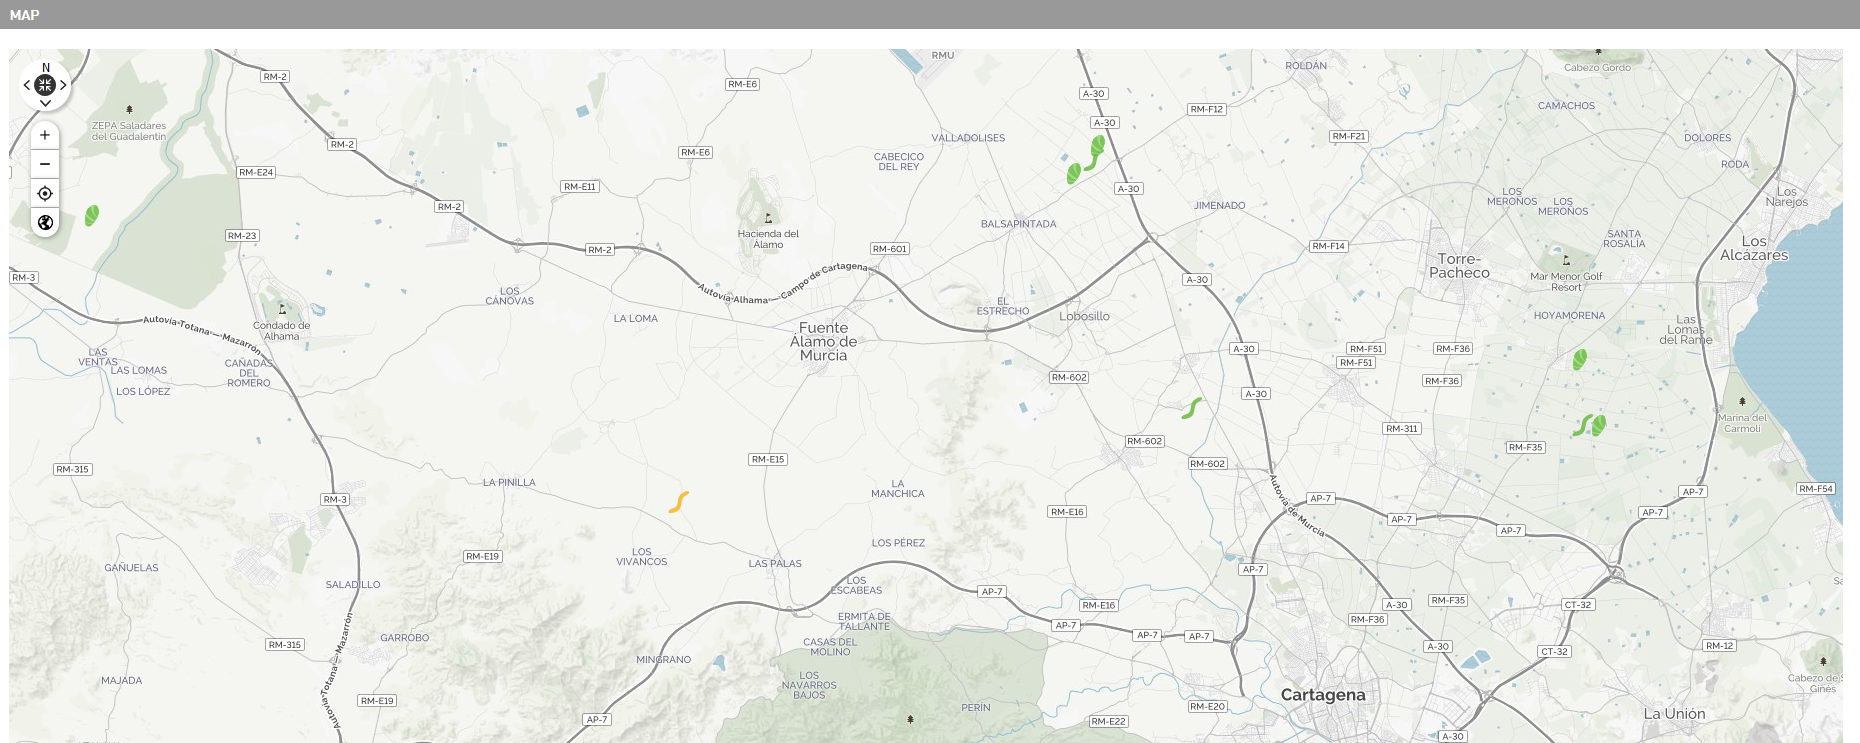
When you click on one of the development stages icons on the map, it showed the info about the device and type of development stage.. By clicking on the serial number, below the map opens the chart of daily catches and development stages.
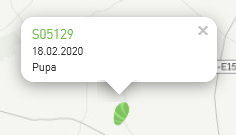
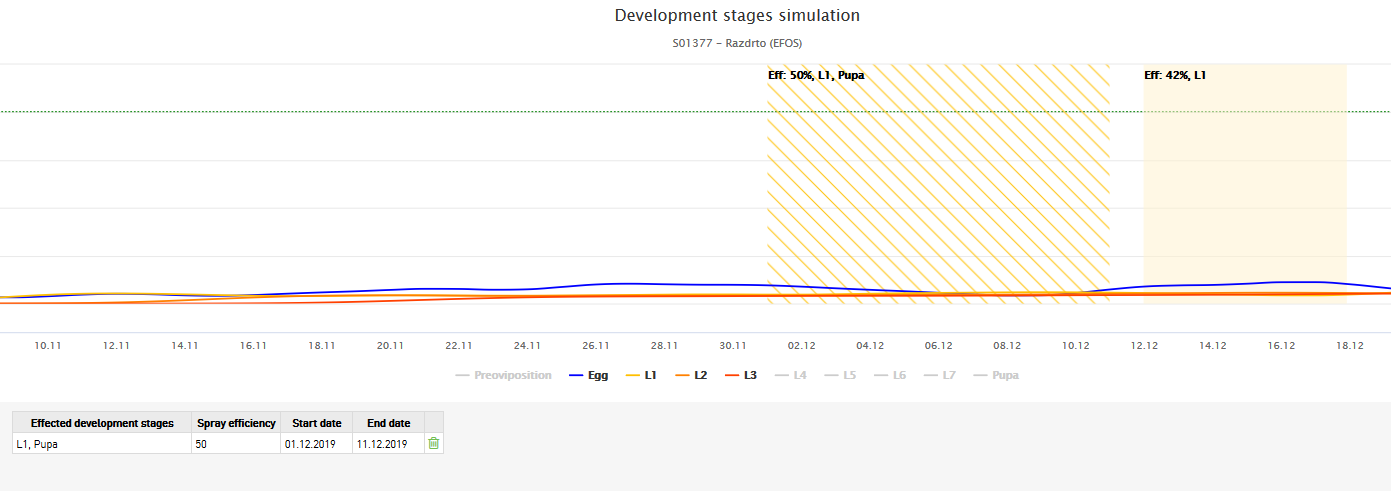
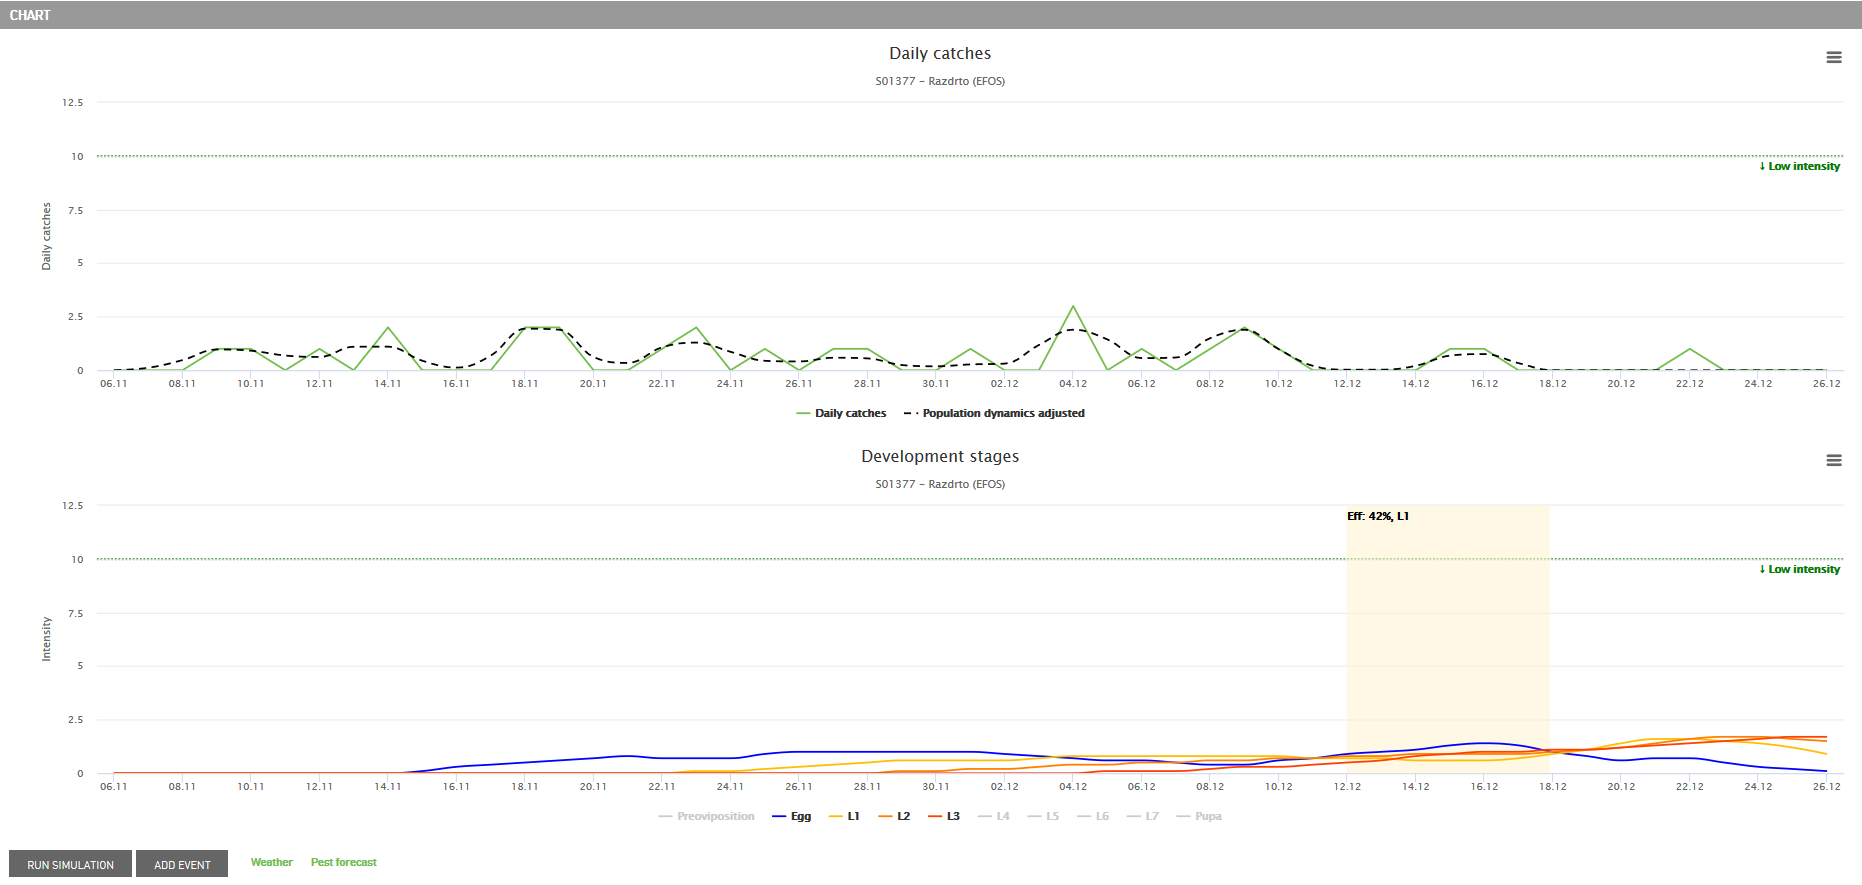
Chart of development stages
The graph shows the progress of the development stages in the selected time period for which the forecast was calculated (ie from the beginning of the season to the selected date and 25 days into the future (if we have enough data)).
Each curve in its color indicates the intensity of each development stage. All dates from the selected date indicate a pest development. The legend indicates the individual stages of development. Each stage has its own curve color. In the legend we choose which curves you want to have on the graph.
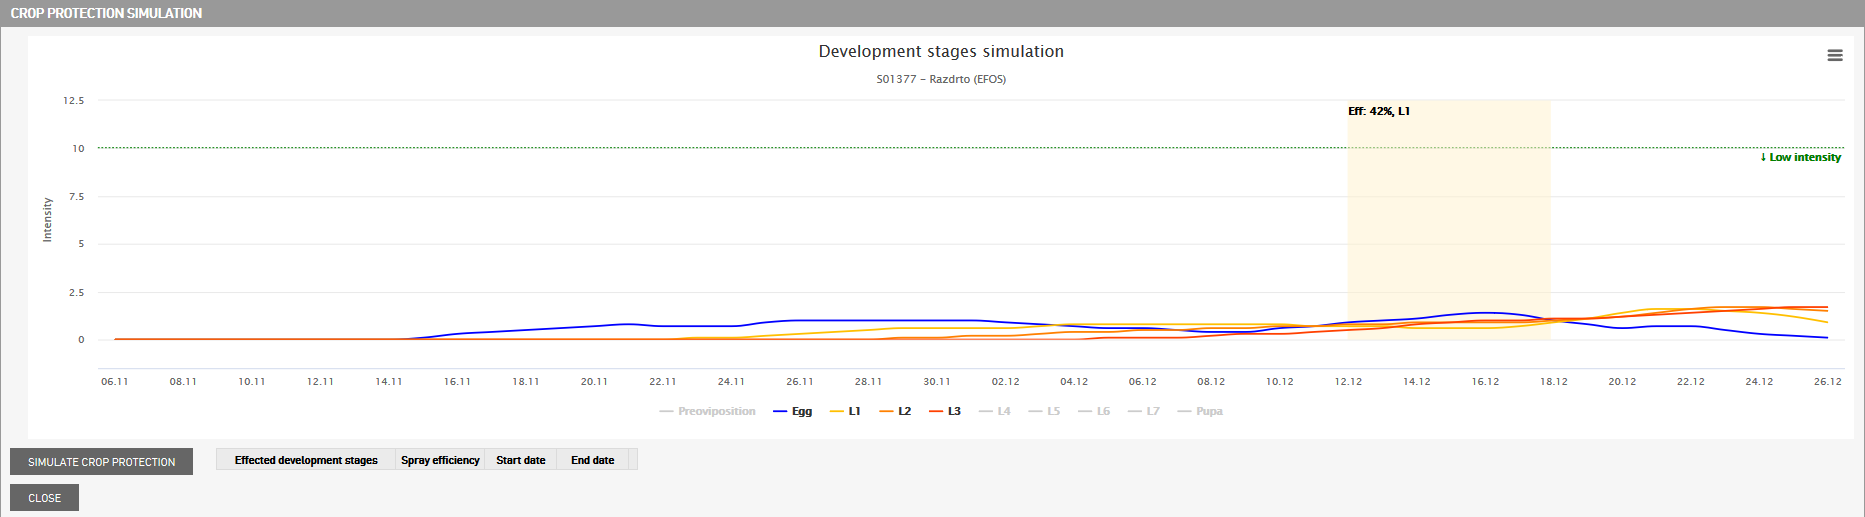
Simulate crop protection
The user has the option to simulate spraying for the future with analyze as well as for the past (for example, at the end of the season, he analyzes what the pest development would be like if he chose some other day for spraying). Or he analyze the correctness of spraying decisions in the previous season.
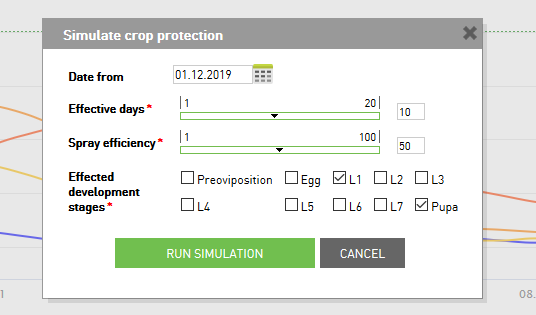
To start crop protection simulation you need to click on Simulate crop protection button on the chart. Opens popup where you need to enter the following four required data:
Date from - select the date on which would you like to spraying
Effective days - duration of spray effect (in days) specified for each spray
Spray efficiency - declared spray efficiency in percentage
Effected development stages - select the development stages for which you want to spraying
To run a simulation, click on Run simulation button, to start simulation on a chart.
The graph simulates when is the best effect of spraying based on the information we have entered to make the spray.