Network health
This feature helps you to have an overview of what happened with your devices like: trap density, signal strenght, battery trend, battery voltage and picture sending status.
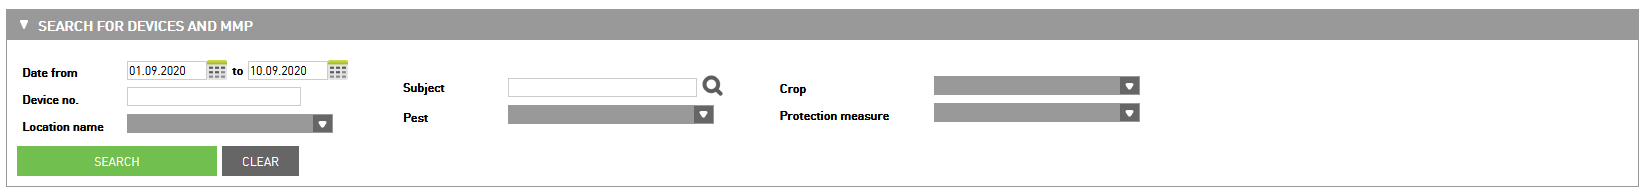
Search for devices
In a search query, you select for which devices you want to check network health. You have the following options to search:
Date from/to - select the date from/to
Device number - enter serial number of device
Location name - you can select devices from locations you have and looking for data only for devices from selected location
Subject - select the subject
Pest, Crop, Protection measure - select the pest, crop or protection measure filter
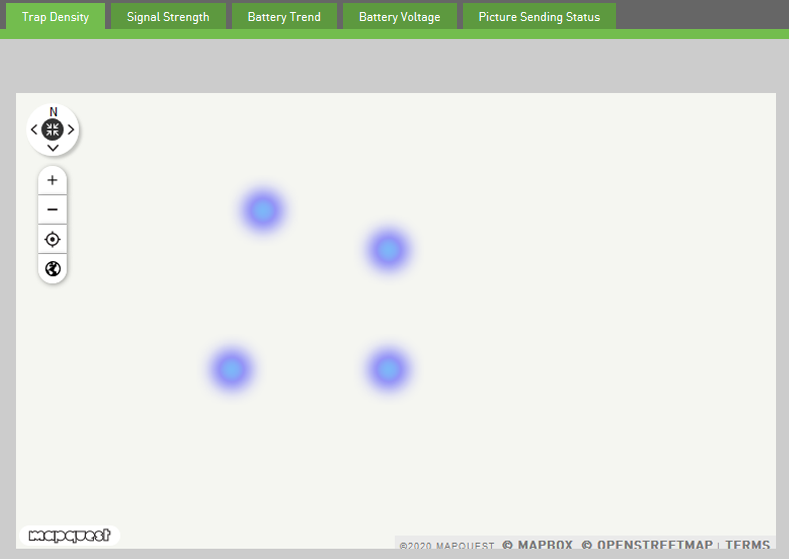
Trap density
On the map, you see a heatmap of trap density. The more traps there are, the redder is the spot.
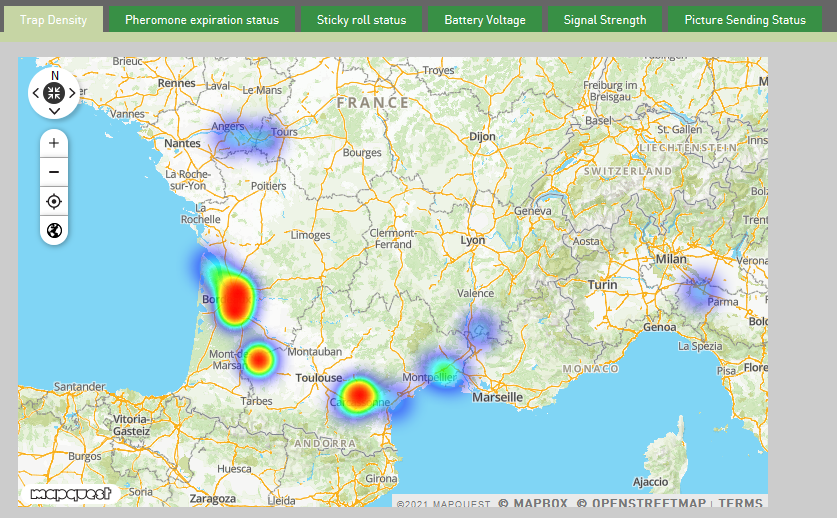
If you zoom in the map you see blue spots which represent traps and you see how many traps in this location.
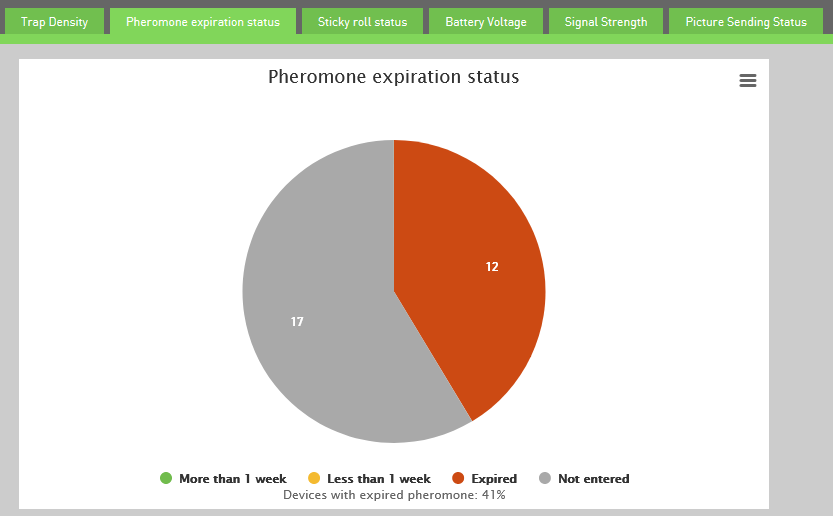
Pheromone expiration status
Under this tab you have the info about expiration status of pheromones in devices. There you receive the info when and on which devices you need go to change a new pheromone.
Pie chart
On the pie chart are four section about expiration status: more than 1 week, less than 1 week, Expired and Not entered.
In every section of the pie chart you have a number that represents how many devices have specific expiration status of pheromone.
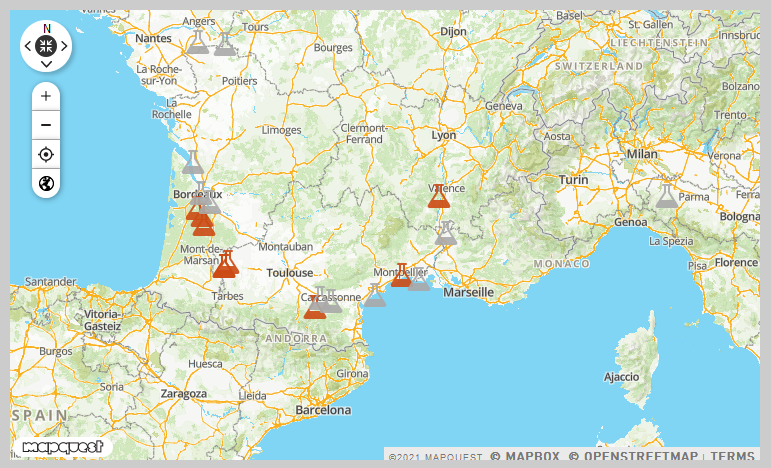
Map
On the map are icons of pheromone expiration status for each device.
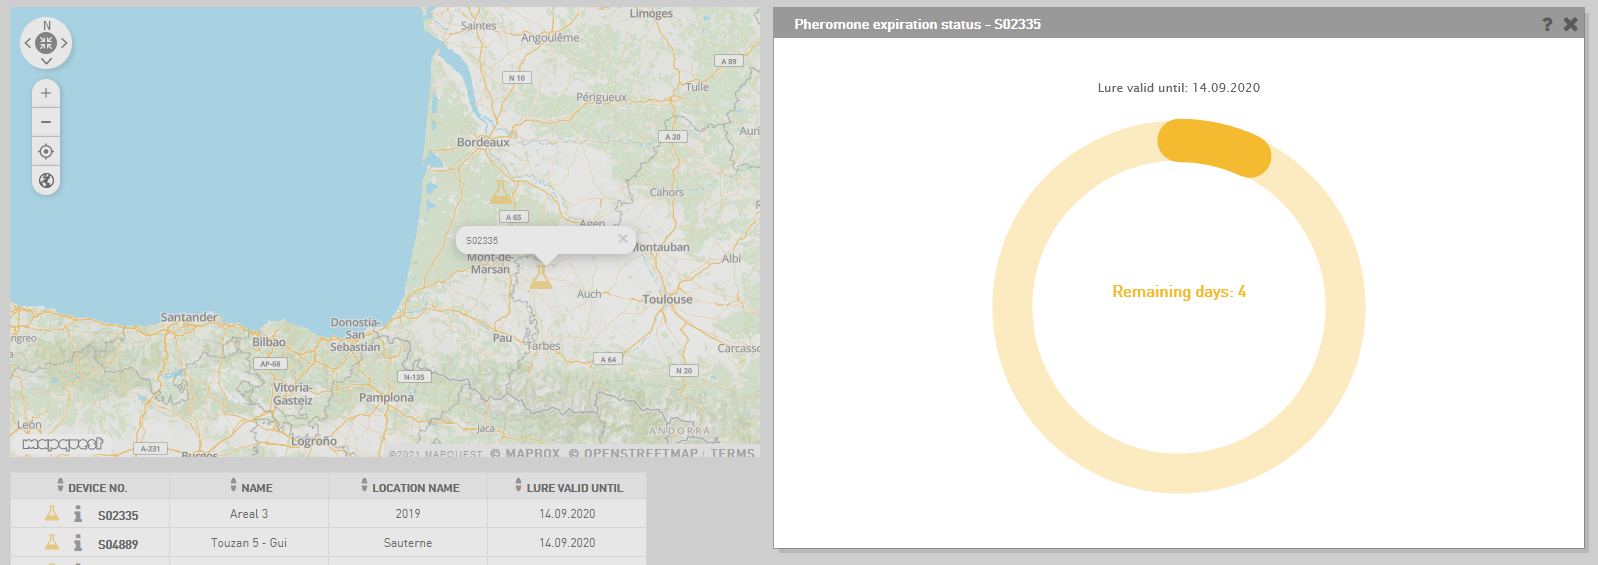
If you click on the icon, shows pop up with chart of pheromone expiration status. In this chart you receive the info how long the lure is valid and how much remaining days still have before you need to change pheromone with a new one.
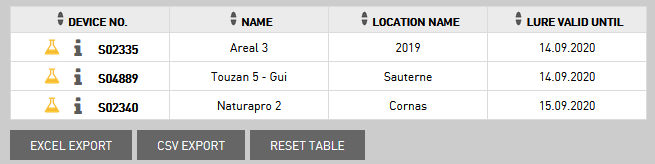
Table
Under the map is a table with the following data (if you click on one of section in pie chart shows the data only for this section):
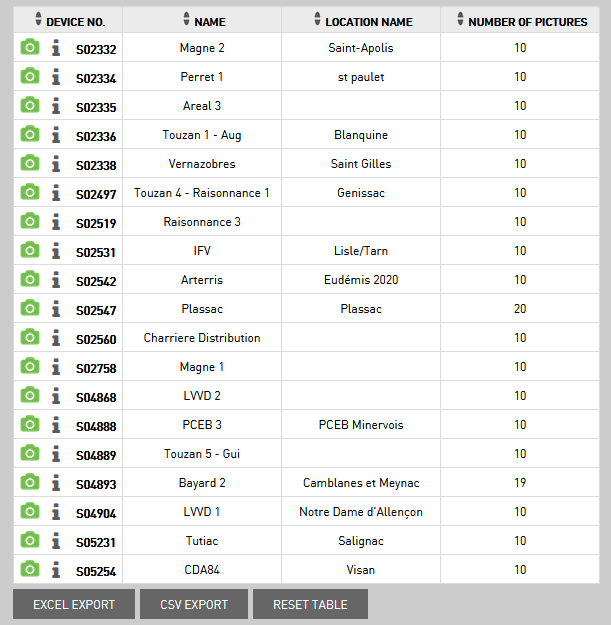
device number - the serial number of device; in this column is the icon of signal strength to show chart of signal strength and device monitoring info icon, to see the info about device monitoring period
name - name of the device
location name - the current location of device
lure valid to - date of lure validation
To export data from the table you click on the button Excel export or CSV export. Data export is for the entire search period. To reset data in the table click Reset table.
Signal strength
It is very important to know how strong is the signal of the device because this is connected with sending pictures. If the signal is low maybe some pictures not sending to the app.
So it is important that you check it. You find the data about it in tab Signal strength.
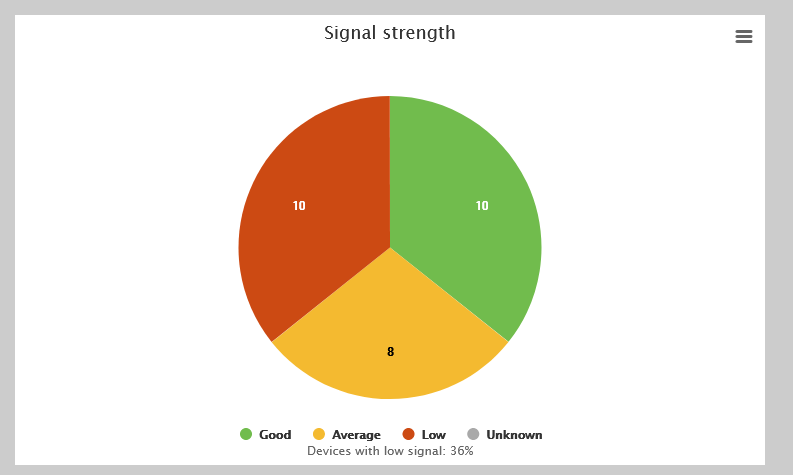
Pie chart
On the pie chart are three sections of the signal strength:
green - good signal
yellow - average signal
red - low signal
In every section of the pie chart, you have a number that represents how many devices have specific signal strength.
Map
On the map are icons of signal strength for each device.
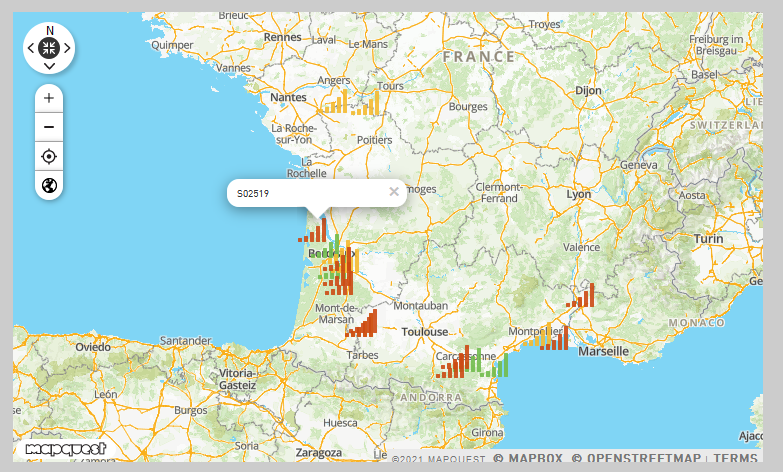
If you click on icon, shows pop up with signal strength chart. In this chart you see the signal strength from the last 7 days from the selected date, if you watch data for one day. If you select period from -to, you see on this chart data for selected period.
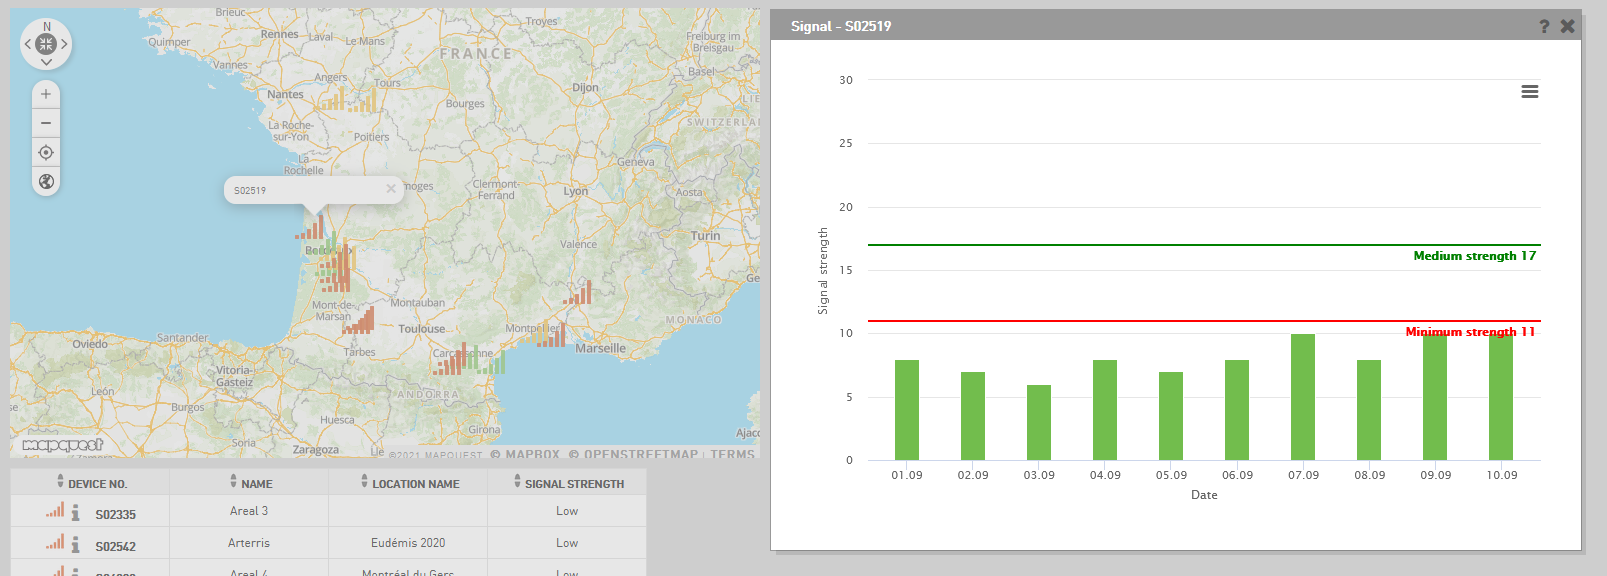
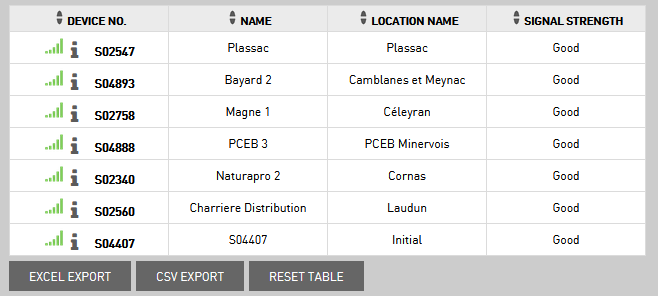
Table
Under the map is a table with the following data (if you click on one of section in pie chart shows the data only for this section):
device number - the serial number of device; in this column is the icon of signal strength to show chart of signal strength and device monitoring info icon, to see the info about device monitoring period
name - name of the device
location name - the current location of device
signal strength - low, average or good signal
To export data from the table you click on the button Excel export or CSV export. Data export is for the entire search period. To reset data in the table click Reset table.
Battery voltage
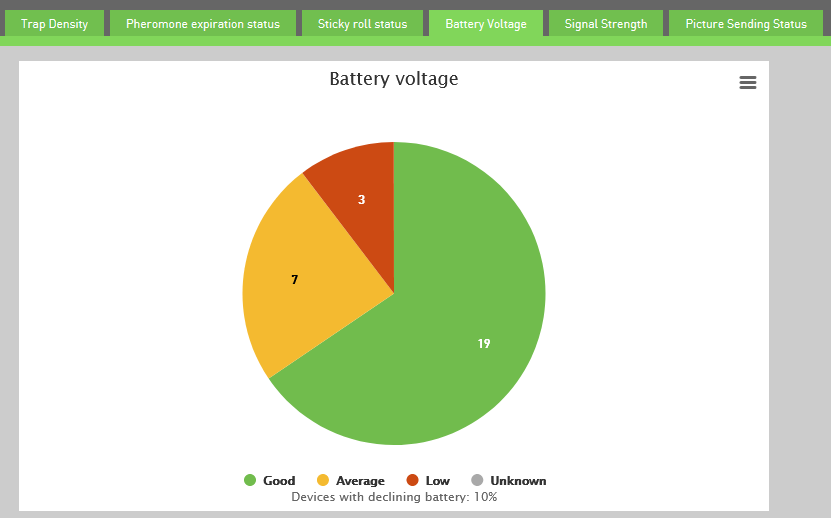
Pie chart
In this tab, you find information about the battery trend for a period of 8 days from the selected date.
In a pie chart are four sections about battery voltage: good, average, low and unknown. In every of this section is a number of how many devices have specific battery voltage.
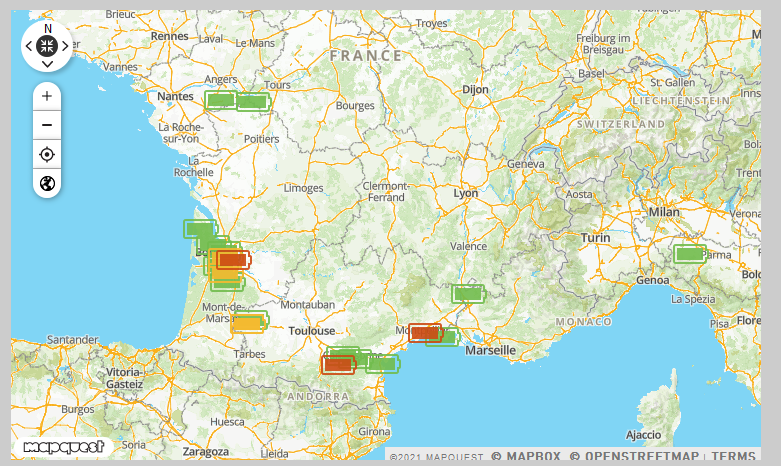
Map
On the map are icons of batery voltage for each device.
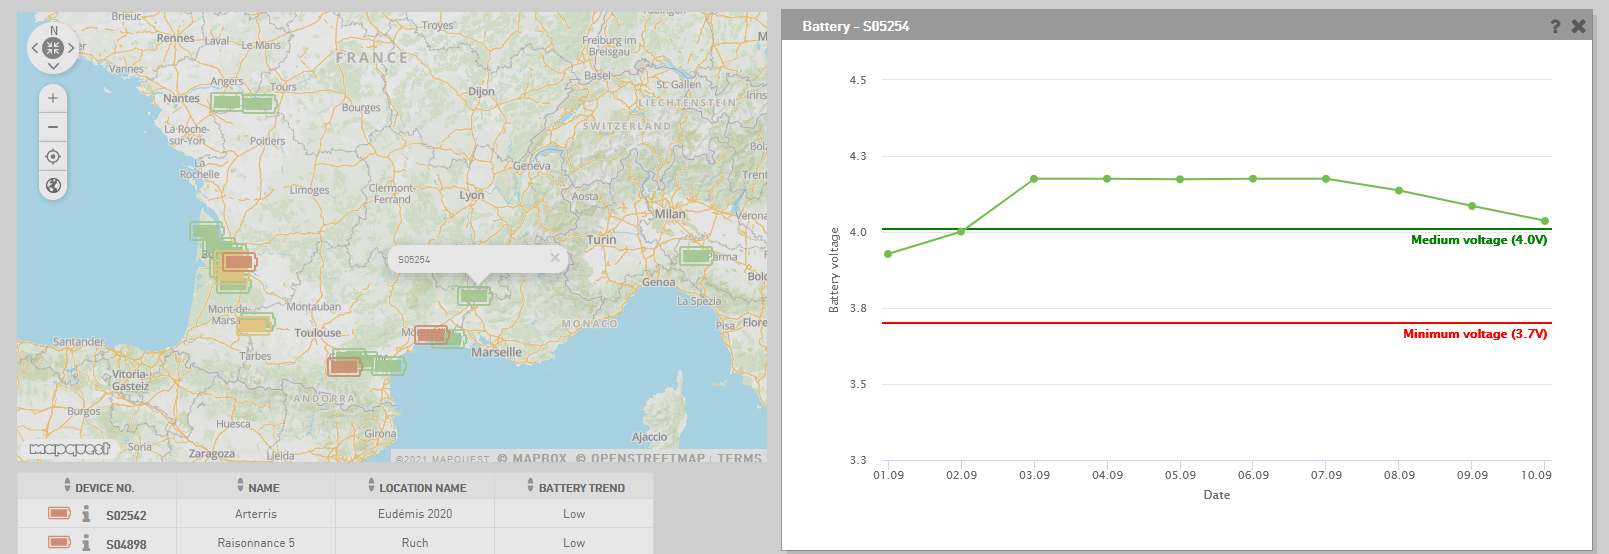
If you click on icon, shows pop up with battery voltage. In this chart you see the battery voltage from the last 7 days from the selected date, if you watch data for one day. If you select period from -to, you see on this chart data for selected period.
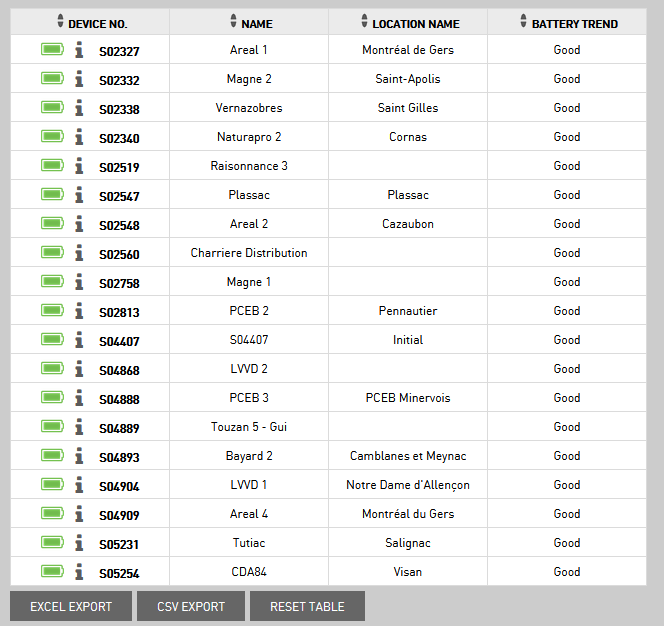
Table
Under the map is a table with the following data (if you click on one of section in pie chart shows the data only for this section):
device number - the serial number of device; in this column is the icon of battery voltage to show chart of battery voltage and device monitoring info icon, to see the info about device monitoring period
name - name of the device
location name - the current location of device
battery trend - low, average or good battery voltage
To export data from the table you click on the button Excel export or CSV export. Data export is for the entire search period. To reset data in the table click Reset table.
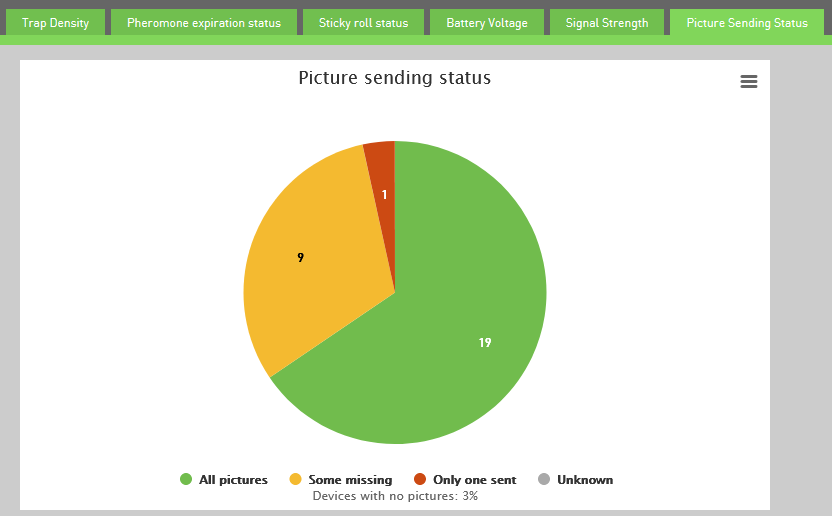
Picture sending status
This feature notifies you of the status of sending pictures. There are three different rates of sending: all pictures, some pictures are missing and only one picture sent.
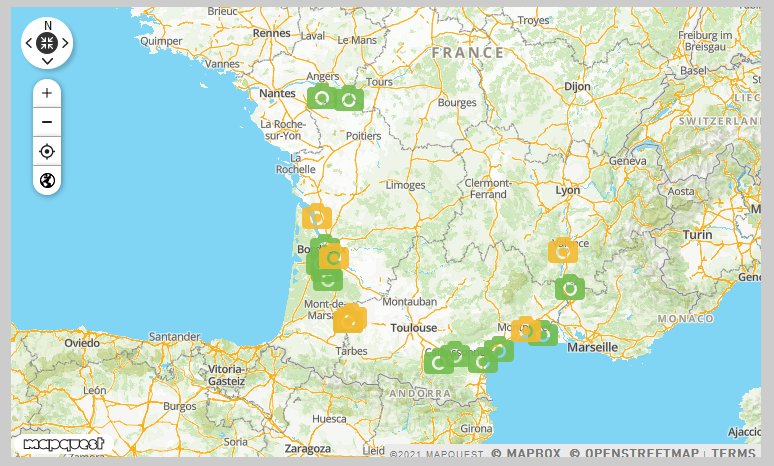
Map
On the map are icons of picture sending status for each device.
If you click on icon, shows pop up with chart of picture sending status. In this chart you see the picture sending status from the last 7 days from the selected date, if you watch data for one day. If you select period from -to, you see on this chart data for selected period.
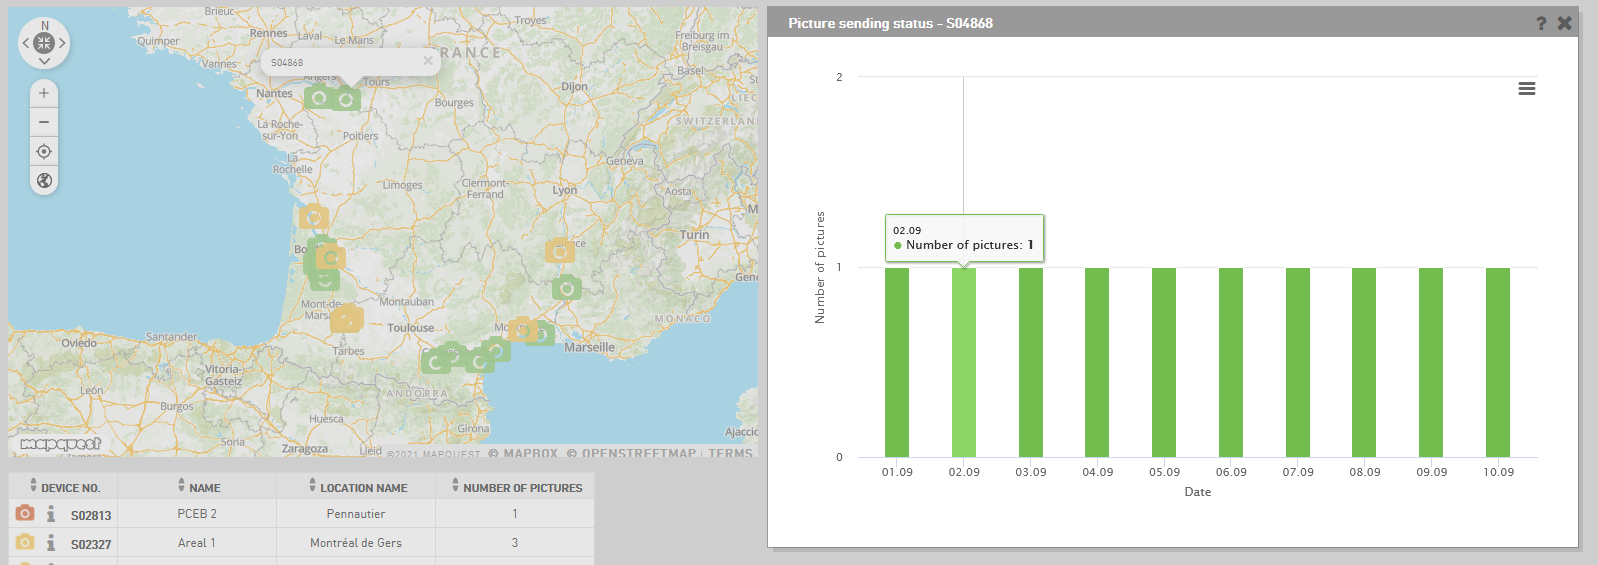
Table
Under the map is a table with the following data (if you click on one of section in pie chart shows the data only for this section in the table):
device number - the serial number of device; in this column is the icon of picture sending status to show chart of battery voltage and device monitoring info icon, to see the info about device monitoring period
name - name of the device
location name - the current location of device
picture sending status - all pictures, some missing, only one sent, unknown
To export data from the table you click on the button Excel export or CSV export. Data export is for the entire search period. To reset data in the table click Reset table.