Accumulated pest pressure
Under AREA WIDE OVERVIEW main menu you have a sector ACCUMULATED PEST PRESSURE.
This form allows you to check accumulated pest pressure for all your locations in the selected time period (default last 7 days).
You can define acc. pest pressure as a sum of all catches of the devices on each location in the selected time period or as a maximum sum of catches in the selected period time on a trap on the selected location.
Default is the sum of all traps on the location.
Search for devices
You can search by different criteria to find devices for which you want to make an observation of accumulated pest pressure:
Date from/to - insert the date of observation
Subject - select the subject
Pest, Crop, Protection measure - select the pest, crop or protection measure filter
Show number of catches on map - click in checkbox to show number of daily catches on the map
Self cleaning mechanism - select checkbox if you want to search devices only with self cleaning mechanism
Acc. pest pressure: Sum of all traps on location - the sum of all traps on each location in selected period time
Acc. pest pressure: Traps with max catches on location - maximum sum of catches in the selected period time on a trap on the selected location
With the button Search execute the query. To clear all the criteria entered, use the button Clear.

Map and table of devices and MMP
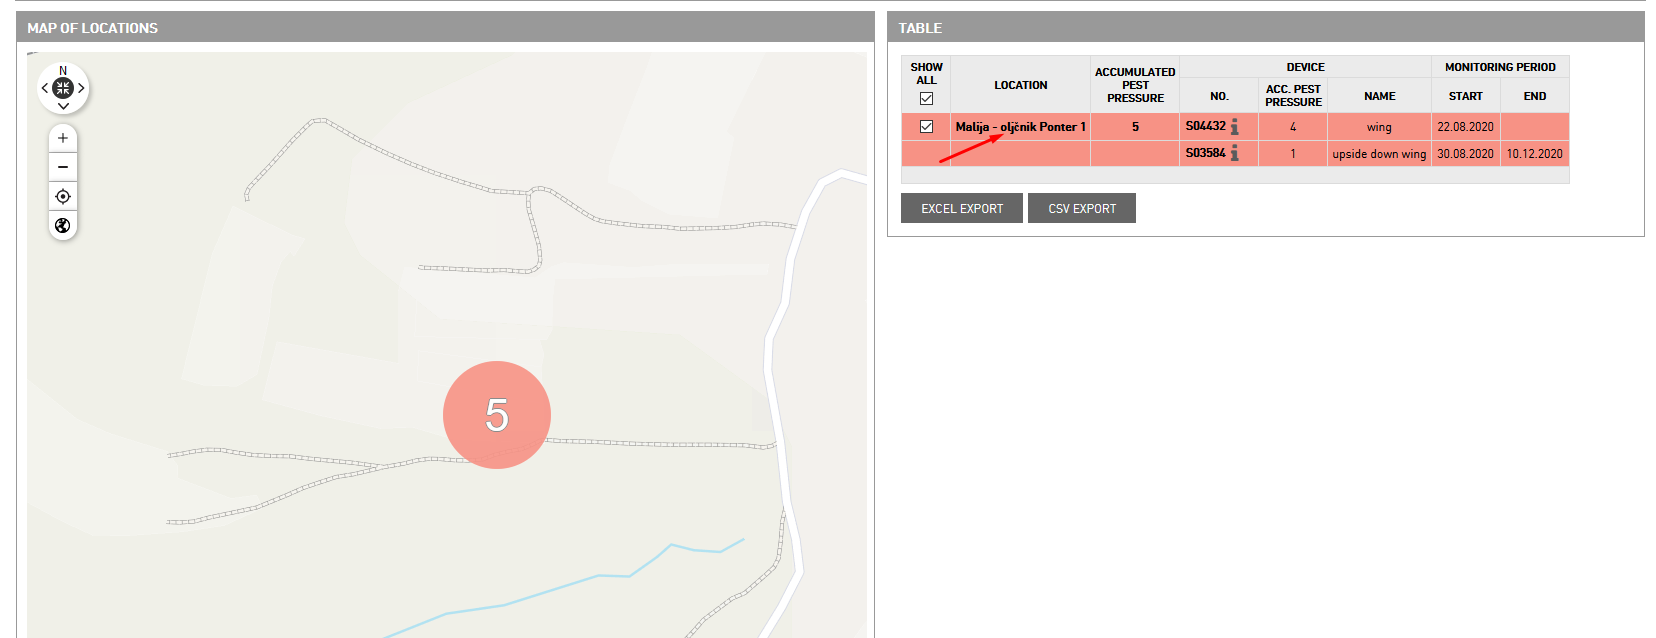
On the map shows the bubbles of accumulated pest pressure. The red ones are locations with the most accumulated pest pressure. The blue ones are locations with minimum accumulated pest pressure.

In the table, you have a list of all locations and their accumulated pest pressure in numbers.
If you want only specific devices to show then you need to disable option “show all” and click in checkboxs before every device number in the table. To export the data from the table click on Excel export or CVS export button.
Average pest pressure chart
The chart shows the average pest pressure on locations in selected period time.

With the zoom option, you have the option to see more detail analysis for a shorter period (to reset the zoom to previous chart data click on Reset zoom button).


In detail analysis, you see the average pest pressure on the selected day, what is the range and which location have min and max pest pressure on this day.

Pest chart of location
To check pest chart to analyze catches per day on location, click on location name in table to open Pest chart for location.
In this chart you find the information about how many catches per day was in a selected location and which devices have catches.

Pest chart of devices
If you want to see the pest chart where you have analyze of catches per day you go in a table to select the trap and click on it to open the pest chart. In this chart you see the number of pest per day and accumulated pest pressure.

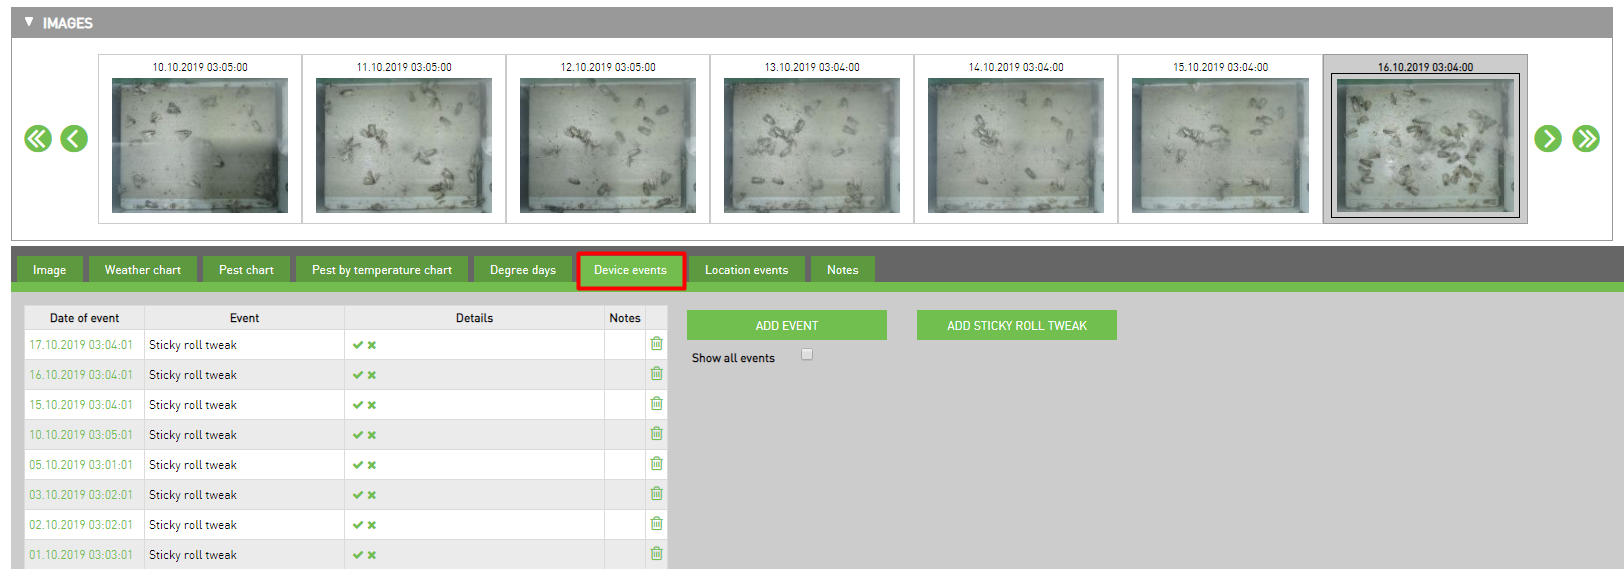
Select the day at the chart where you want to see the picture of catches. Click on the image to open it in device events.

You have the option of marking pests if you see that they are incorrect. It is very important that the marks are correct if we want to have the right data about accumulated pest pressure.

Another important thing is that we are regularly triggering self-cleaning. To check when was the last time where you triggered self-cleaning go to Device events tab to see when it was triggered.