Reports
With fully automated reports, user gets all vital information about pest population and managment of grid of automated trap in his mailbox or as a push notification to the mobile phone. All high-level information from the dashboard are detailed with the same report and more interactive approach is available through the link to app.In addition, all reports are stored and can be used as documentation proof to justify crop protection activities.
How to set up Trapview reports
To set a report, go to Reports tab under User settings and click on Manage reports button.
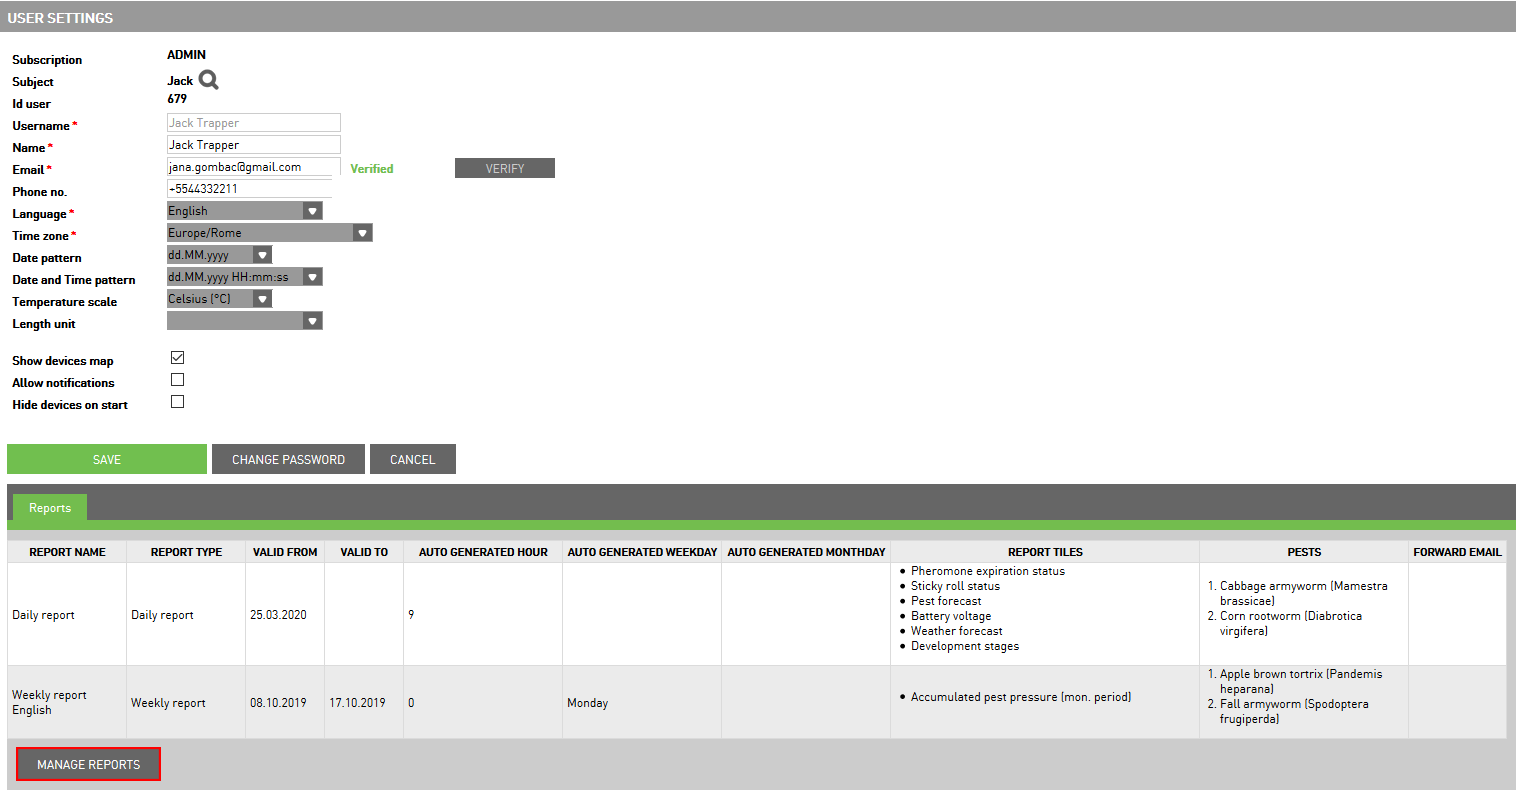
A new window open, where you set a reports. In the beginning, you have information about the subject which is the owner of reports. You have the option to set three types of reports: daily report, weekly and moth report.
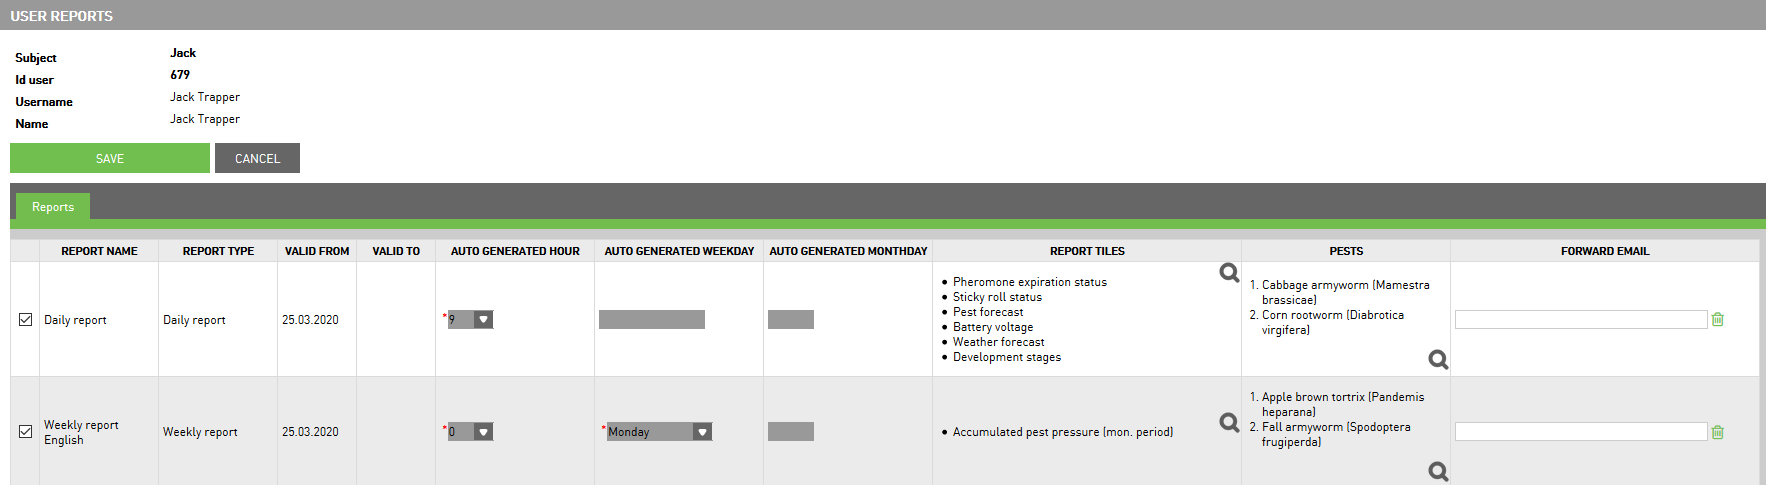
Below is a report settings table where you enter the following data:
report name - the name of report
report type - the type of report (daily, weekly,monthly report)
valid from / valid to - the time of report validity (report starting with the day when you set it)
auto generated hours - set the hour when you want to be your report generated
auto generated weekday - set the day in a week when you want to be your report generated
auto generated monthday - set the day in a month when you want to be your report generated
report tiles - the list of report tiles which included in report; to select them click on the
 icon to open the list of report tiles

pests - the list of pests which included in report; to select them click on the
icon to open the list of pests

forward email - insert email to forward the reports to other users; you may insert multiple email addresses separated by semicolon
To save the settings of report click on Save button or click on Cancel if you don’t want to set reports.
View and generate reports
To view and generate reports go to Reports tab under Devices and MMP. You can search for a specific report by different criteria:
Report type - select the type of reports
Subject - select the subject for which reports do you want to see
User - select the user for which reports do you want to see
Pest - select the pest to show all reports with selected pest
Crop - select the crop to show all reports with selected pest
From day - shows all report from selected date
To day - shows all reports to selected date
Updated - shows all reports which were updated on selected date
With the button Search execute the query. To clear all the criteria entered, use the button Clear.

List of reports
Each table row represent one report with the next information:
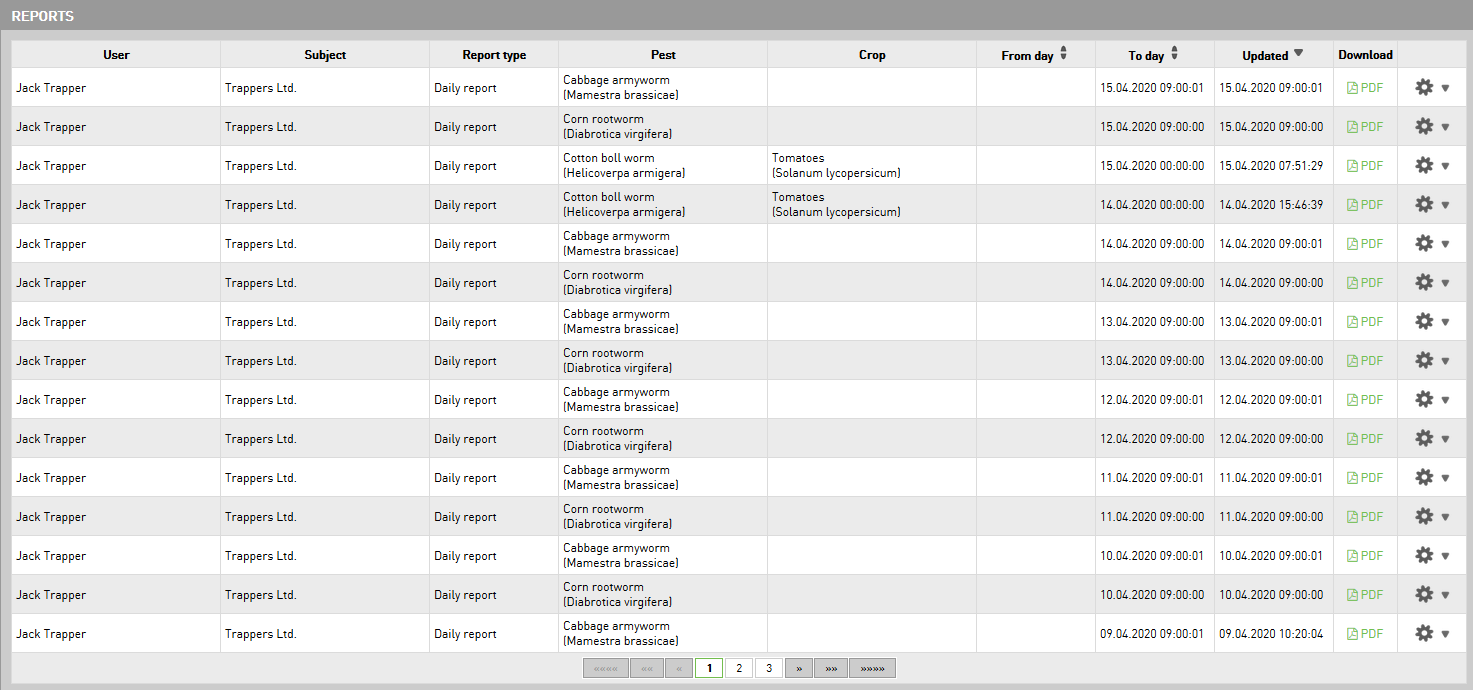
User - which user is owner of report
Subject - which subject is owner of report
Report type - which type of report is
Pest - which pest included in report
Crop - which crop included in report
From day - from when the report is valid
To day - to when the report is valid
Updated - when was the report last updated
Download - download report in PDF format to your computer
Cogwheel - if you click on the cogwheel you have two options what to do with the report: refresh or refresh and send to email which you set under the report settings

Generate reports
When setting up reports, we choose when the report should be automatically generated. If we want to generate a report outside of automatic generation we can do this by going to the “Generate reports” tab under “Reports”.

Enter the following information that is required to generate the report:
Date - select the date on which you want the report to be generated
User - select the user for which you want the report to be generated; when a user is selected, it is automatically displayed which subject the selected user belongs to
Pest - select the pest which will be included in the report
Crop - select the crop which will be included in the report
Report type - select the type of report do you want to generate (daily, weekly, monthly)
Use default report tiles - when you select a report type, it automatically activates use the default report tiles, which means that any report tiles you set during the report setup will be included in the generated report; if you don’t want to have all tiles included in a report than you need to remove a tick from the checkbox; when you do this shows the list of all tiles and you can select which ones do you want to include in the report

To generate report click on Generate button or click on Clear if you cancel it. When you generated your report you can find it in the report list under view reports tab, where you can download it in PDF format to your computer.
Explanations of the report
Daily report
The daily report shows key data and trends in the first HIGHLIGHTS section, followed by sections AGGREGATED DATA and DETAILED DATA. Hyperlinks help you easily browse through your reports. By clicking on the following icons you can move through various parts of your report or even go directly to the web application:
Pie chart icon - always takes you to the HIGHLIGHTS section
Summary table icon - takes you from the AGGREGATED DATA to the DETAILED DATA
Pinpoint icon - takes you from the DETAILED DATA back to the AGGREGATED DATA
Moth icon - takes you directly to the specific data inside the web application
Daily report includes information about a set of traps in the latest period. The data is displayed according to the report parameters (user, pest, crop, day). In case the trap has not sent the latest data by the time the report is generated (the sending time of picture or telemetry is set after report generation), the data received in the last 48 hours will be taken into account.
Note: If manual verification of the automatic recognition results is required, only the pictures that have been validated will be included in the report.
Report tiles
New pests
The traps are classified into three categories according to the number of new pests detected in the last day: 1) low pest pressure, 2) medium pest pressure, 3) high pest pressure. The classification is made on the basis of the daily pest pressure thresholds set manually by the user inside the Trapview app. The daily pest pressure thresholds are set when starting a new monitoring period in the Trapview app and the possibility of their later change is enabled.
Accumulated pest pressure last week
The devices are grouped into five categories according to the total of pest catches over the last week. Each trap is classified according to the accumulated pest pressure in the relevant time period. Each category normally represents a range (e.g. 0-8 catches, 9-16 catches, etc.). If the catches are few, each category represents a certain number (e.g. 0, 1, 2, etc.).
The reports include traps that are active during the reporting period. In case a trap is moved to another location and set to monitor a different pest, it will still be included in the accumulated pest pressure summaries, indicating the sum of catches at the time of removal. In case a trap is moved to another location and set to monitor the same pest, it will be included in the summaries twice, indicating the catches from each location separately. In case the new monitoring period is not entered into the Trapview application, the chart referring to the time from the beginning of the monitoring period takes into account the last six months data.
Degree days
The devices are grouped into five categories according to the cumulative of the degree days in their location (last generation started in Trapview app). Each trap is classified according to the degree days cumulative. Each category normally represents a range (e.g. 0-80.99 degree days, 81-100.99 degree days etc.). The estimated degree days cumulative for the next six days is included in the Detailed section. The forecast calculation is based on outsourced temperature data.
Average pest pressure
he calculated daily average of pest catches (black line), the maximum daily catch (top line) and minimum daily catch (bottom line) are presented. The total average pest pressure in the relevant period is displayed above the graph.
Pest forecast
Only the traps with enabled Pest forecast are included in the chart. The traps are classified into three categories according to whether Low, High or Medium pest pressure is expected in the next days. “NO data available” can appear for various reasons: 1) there is no data to display because the pest forecast is not enabled for the traps, 2) the pictures have not been sent or 3) the pictures have not been manually validated yet (in case that is required).
Development stages
The devices are grouped into three intensity categories Low, Medium and High according to the intensity of the development stage on the last day. The intensity of development stages correlates with the daily pest pressure thresholds. The current development stage at a given intensity is evident from the Aggregated data and Detailed data sections. The last column of the Detailed data also lists the predicted intensity trends and ongoing spraying events. “NO data available” can appear for various reasons: 1) there is no data to display because the stage development prediction is not enabled for the traps, 2) the pictures have not been sent or 3) the pictures have not been manually validated yet (in case that is required).
Weather forecast
The weather icon inside the Highlights section serves as a quick link to the Aggregated data, where the traps are classified according to the weather forecast and displayed on the map. The weather forecast for individual trap locations can be found in the Detailed data section. “NO data available” means that there is no data to display because the weather forecast is not enabled for the traps.
Pheromone expiration status
The devices are grouped into four categories as follows: 1) the pheromone has already expired, 2) the pheromone expires in less than one week, 3) the pheromone expires in more than one week and 4) expiration data is not recorded in the system. The pheromone expiration date can be logged into the system under “Device events” when logging the event for each trap separately. Another option is to “Add an event to many devices” under “Devices and MMP” in the main menu, which can be used when logging the same pheromone change for multiple traps.
Sticky roll status
Only the traps with self-cleaning mechanism are included in the chart. The traps are sorted into three categories with respect to the number of remaining sticky roll tweaks: 1) more than ten tweaks left, 2) five to ten tweaks left, 3) less than five tweaks left. “NO data available” means that none of the traps have self-cleaning mechanism.
Battery voltage
Show the number of traps with regards to the battery status (voltage). The traps are classified into four categories according to whether Battery voltage is Low (including or below 3.7 V), Good (above 4 V), Average (above 3.7 V to including 4 V) or Unknown if the data was not received.
Signal strength
Shows the number of traps with regards to the signal strength (RSSI value). The traps are classified into four categories according to whether the signal strength is Low (including or below 11), Good (above 17), Average (above 11 to including 17) or Unknown if the data was not received.
Picture sending status
The traps are classified into two categories with regards to the successfully sent pictures in the last day. If multiple pictures are set to be captured per day, the picture sending status is considered successful in case at least one picture was sent.
Weekly report
The weekly report shows key data and trends in the first HIGHLIGHTS section, followed by sections AGGREGATED DATA and DETAILED DATA. Hyperlinks help you easily browse through your reports. By clicking on the following icons you can move through various parts of your report or even go directly to the web application:
Pie chart icon - always takes you to the HIGHLIGHTS section
Summary table icon - takes you from the AGGREGATED DATA to the DETAILED DATA
Pinpoint icon - takes you from the DETAILED DATA back to the AGGREGATED DATA
Moth icon - takes you directly to the specific data inside the web application
Included in the report is the information regarding a set of traps in a period of the last week. The data is displayed according to the report parameters (user, pest, crop, day). In case the trap has not sent the latest data by the time the report is generated (the sending time of picture or telemetry is set after report generation), the data from the last 8 days will be taken into account.
Note: If manual verification of the automatic recognition results is required, only the pictures that have been validated will be included in the report.
Report tiles
Accumulated pest pressure last week / month / monitoring period
The devices are grouped into five categories according to the total of pest catches over the last week, last month or from the start of the monitoring period. Each trap is classified according to the accumulated pest pressure in the relevant time period. Each category normally represents a range (e.g. 0-8 catches, 9-16 catches, etc.). If the catches are few, each category represents a certain number (e.g. 0, 1, 2, etc.). The reports include traps that are active during the reporting period. In case a trap is moved to another location and set to monitor a different pest, it will still be included in the accumulated pest pressure summaries, indicating the sum of catches at the time of removal. In case a trap is moved to another location and set to monitor the same pest, it will be included in the summaries twice, indicating the catches from each location separately. In case the new monitoring period is not entered into the Trapview application, the chart referring to the time from the beginning of the monitoring period takes into account the last six months data.
Degree days
The devices are grouped into five categories according to the cumulative of the degree days in l (last generation started in Trapview app.). Each trap is classified according to the degree days cumulative. Each category normally represents a range (e.g. 0-80.99 degree days, 81-100.99 degree days etc.). The estimated degree days cumulative for the next six days is included in the Detailed section. The forecast calculation is based on outsourced temperature data.
Average pest pressure
The calculated daily average of pest catches (black line), the maximum daily catch (top line) and minimum daily catch (bottom line) are presented. The total average pest pressure in the relevant time period is displayed above the graph.
Pest forecast
Only the traps with enabled Pest forecast are included in the chart. The traps are classified into three categories according to whether Low, High or Medium pest pressure is expected in the next days. “NO data available” can appear for various reasons: 1) there is no data to display because the pest forecast is not enabled for the traps, 2) the pictures have not been sent or 3) the pictures have not been manually validated yet (in case that is required).
Development stages
The devices are grouped into three intensity categories Low, Medium and High according to the intensity of the development stage on the last day. The intensity of development stages correlates with the daily pest pressure thresholds. The current stage of development at a given intensity is evident from aggregated and detailed data which follows together with the predicted intensity trend and ongoing spraying events info in the last column. “NO data available” can appear for various reasons: 1) there is no data to display because the stage development prediction is not enabled for the traps, 2) the pictures have not been sent or 3) the pictures have not been manually validated yet (in case that is required).
Weather forecast
The weather icon inside the Highlights section serves as a quick link to the Aggregated data, where the traps are classified according to the weather forecast and displayed on the map. The weather forecast for individual trap locations can be found in the detailed data section. “NO data available” means that there is no data to display because the weather forecast is not enabled for the traps.
Pheromone expiration status
The devices are grouped into four categories as follows: 1) the pheromone has already expired, 2) the pheromone expires in less than one week, 3) the pheromone expires in more than one week and 4) no expiration data is recorded in the system. The pheromone expiration date can be logged into the system under “Device events” when logging an event for each trap separately. Another option is to “Add an event to many devices” under “Devices and MMP” in the main menu, which can be used when logging the same pheromone change for multiple traps.
Sticky roll status
respect to the number of remaining sticky roll tweaks: 1) more than ten tweaks left, 2) five to ten tweaks left, 3) less than five tweaks left. “NO data available” means that none of the traps have self-cleaning mechanism.
Battery voltage
The traps are classified into four categories with regards to the battery status over the past week: 1) low battery voltage (at least one day at 3.7 V or below plus a descending trend throughout the week), 2) good battery voltage (each day above 4 V), 3) average battery voltage (all other options) and 4) unknown (in case the data has not been received).
Signal strength
The traps are classified into four categories with regards to the signal strength (RSSI value) over the last week: 1) low signal strength (at least one day at 11 or below plus a descending trend throughout the week), good signal strength (each day at 17 or above), average signal strength (all other options) and 4) unknown (in case the data has not been received).
Picture sending status
The traps are classified into four categories with regards to the successfully sent pictures over the past week: 1) all pictures were sent successfully, 2) some pictures are missing, 3) only one picture was sent and 4) unknown. If multiple pictures are set to be captured per day, the picture sending status is considered successful in case at least one picture was sent.